

LIVE Dashboard
07/18/2025
Summary
Are you looking for the solution to tracking your LIVE performance comprehensively, during and after your LIVE? Look no further!
Read on to learn more about how the dashboard can help you level-up your LIVE performance!
Benefits of LIVE Dashboard
The LIVE Dashboard enables Creators/Sellers to:- Gain high-level overview of all your key LIVE metrics during and after your LIVE completion along with helpful data benchmarks to compare performance
- Understand overall trends and breakdowns related to your LIVE traffic, trends related to user viewing and conversion funnels for your products
- Keep using the LIVE dashboard to track important metric trends during the LIVE session, and compare these trends with key events (like violations, pins, and promotions) to identify the main factors causing any changes.
- Have a deep dive into real-time performance of your various channels driving traffic into the LIVE.
- Get detailed breakdowns of your product level performance, real-time drilldowns of violations and information for giveaways during and after your LIVE

Example Use Cases
The following use cases will be the most relevant for Creators/Sellers using the LIVE Dashboard on PC.Use Case 1: Track and monitor high level LIVE performance metrics
Goal: Analyze performance and identify key problem areas- Users will be able to view and monitor the high-level financial, traffic and conversion metrics, at one glance, during and after the LIVEs.
- Users can customize the metrics they see to provide more tailored visibility of important LIVE performance factors.
- Understand the market benchmarks for the worst performing metric during LIVE and worst 3 metrics after the LIVE
Use Case 2: Identify and understand trends for your LIVE
Goal: Monitor the LIVE flow in real-time and make adjustments as needed.- Track the patterns for how your audience is engaging with your LIVE by tracking the trends of engagement indicators throughout your LIVE.
- Select specific LIVE metrics to look at variation patterns and understand which metrics need attention or improvement at specific points in the LIVE.
- For in-depth trend information, users can select specific pre-available time durations/segments to target their trend analysis for periods of interest in the LIVE.
- Cross-check trends with important events during the LIVE to understand how these events are affecting LIVE metric performance.
Use Case 3: Deep-dive into traffic, conversion and demographic patterns
Goal: Analyze user profiles and related traffic patterns for your LIVE.- Users can explore which traffic channels (paid or organic) are driving audiences to their LIVEs, allowing for better prioritization of traffic targeting strategy.
- Keep tracking your conversion funnel from impressions to checkout and understand where there are conversion bottlenecks that need to be addressed.
- Explore your audience profile to identify your audience's composition and tailor your strategy either to appeal to these audiences or target users with lesser engagement
Use Case 4: Look at and analyze the performance of your traffic channels to optimize your LIVE channel strategy
Goal: Track impressions, views, GMV and more across your channels to visualize and optimize your channel strategy- Understand viewership trends across the various channels from which audiences are entering your LIVE, in real-time.
- Pick and choose channels to compare against enabling a side-by-side comparison of channel efficacy
Use Case 5: Investigate product, violations and promotions information for LIVEs
Goal: Review product performance to prioritize effectively, track giveaway performance, or resolve violations to enhance LIVE performance.- Users can track key metrics for individual products and also view how pinned products are performing
- Users can view their violations during the LIVE session, along with violation reasons, playback clips, and suggested solutions — all in one place.
- Track the status of product performance during giveaways to investigate their effectiveness and which products are generating interest.
Use Case 6: Replay your LIVE and track comments in real-time
Goal: Monitor user comments and respond to questions in real-time.- Watch your LIVE replayed in real-time or watch the entire broadcast after your LIVE. Track user comments to understand user sentiments and craft engagement strategy with your audience.
- Trend information is dynamically linked with the LIVE replay, allowing you to click areas on the trend timeline to be navigated to that exact point in the LIVE broadcast.

Accessing LIVE Dashboard
All Creators/Sellers on TikTok Shop who are creating Shoppable LIVE content will have access to the LIVE Dashboard via PC.
Entrance to LIVE Dashboard
The Live Dashboard can be entered from Seller Center -> Live & Video -> Live ManagerDuring an ongoing LIVE
The LIVE dashboard can be accessed during your ongoing LIVE from the LIVE Manager on Streamer Desktop by clicking on the dashboard icon: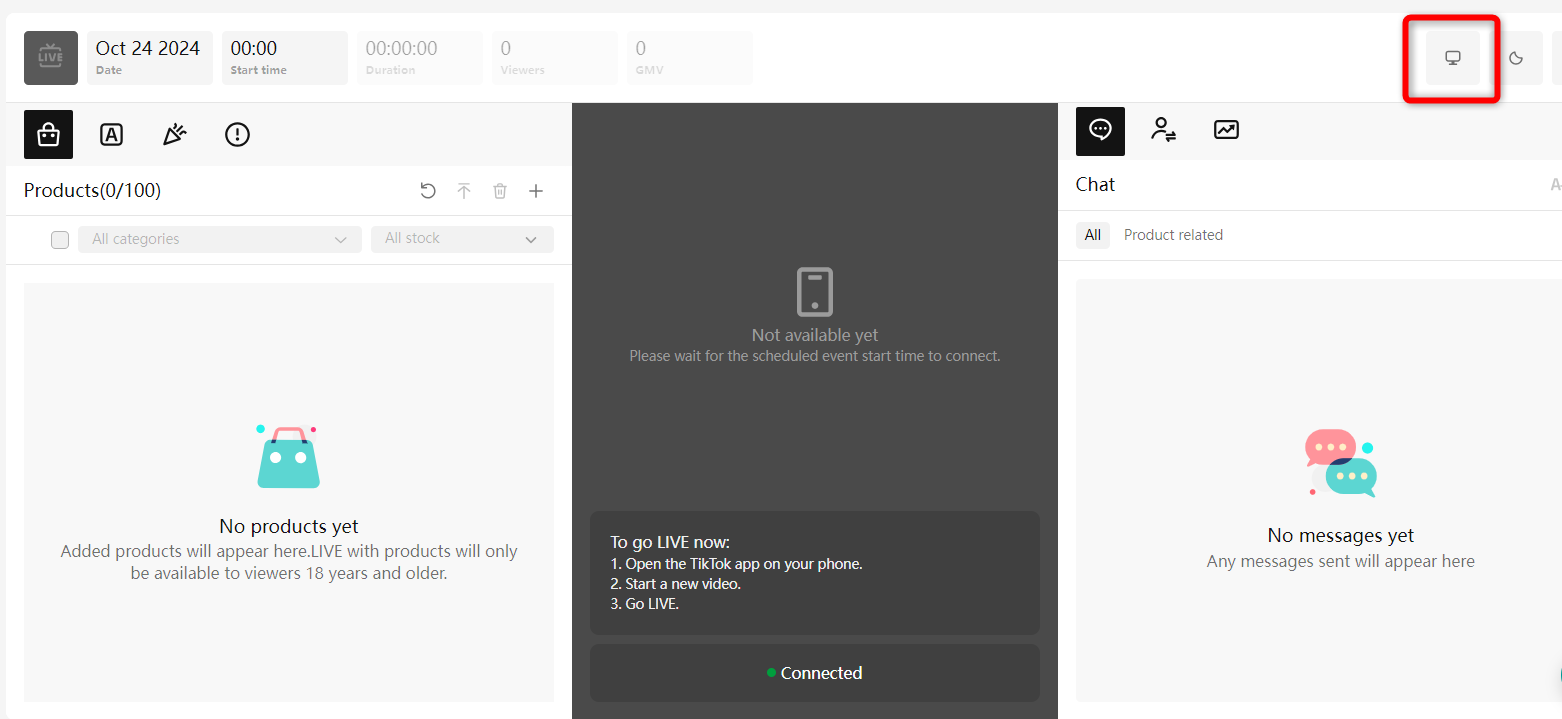 | 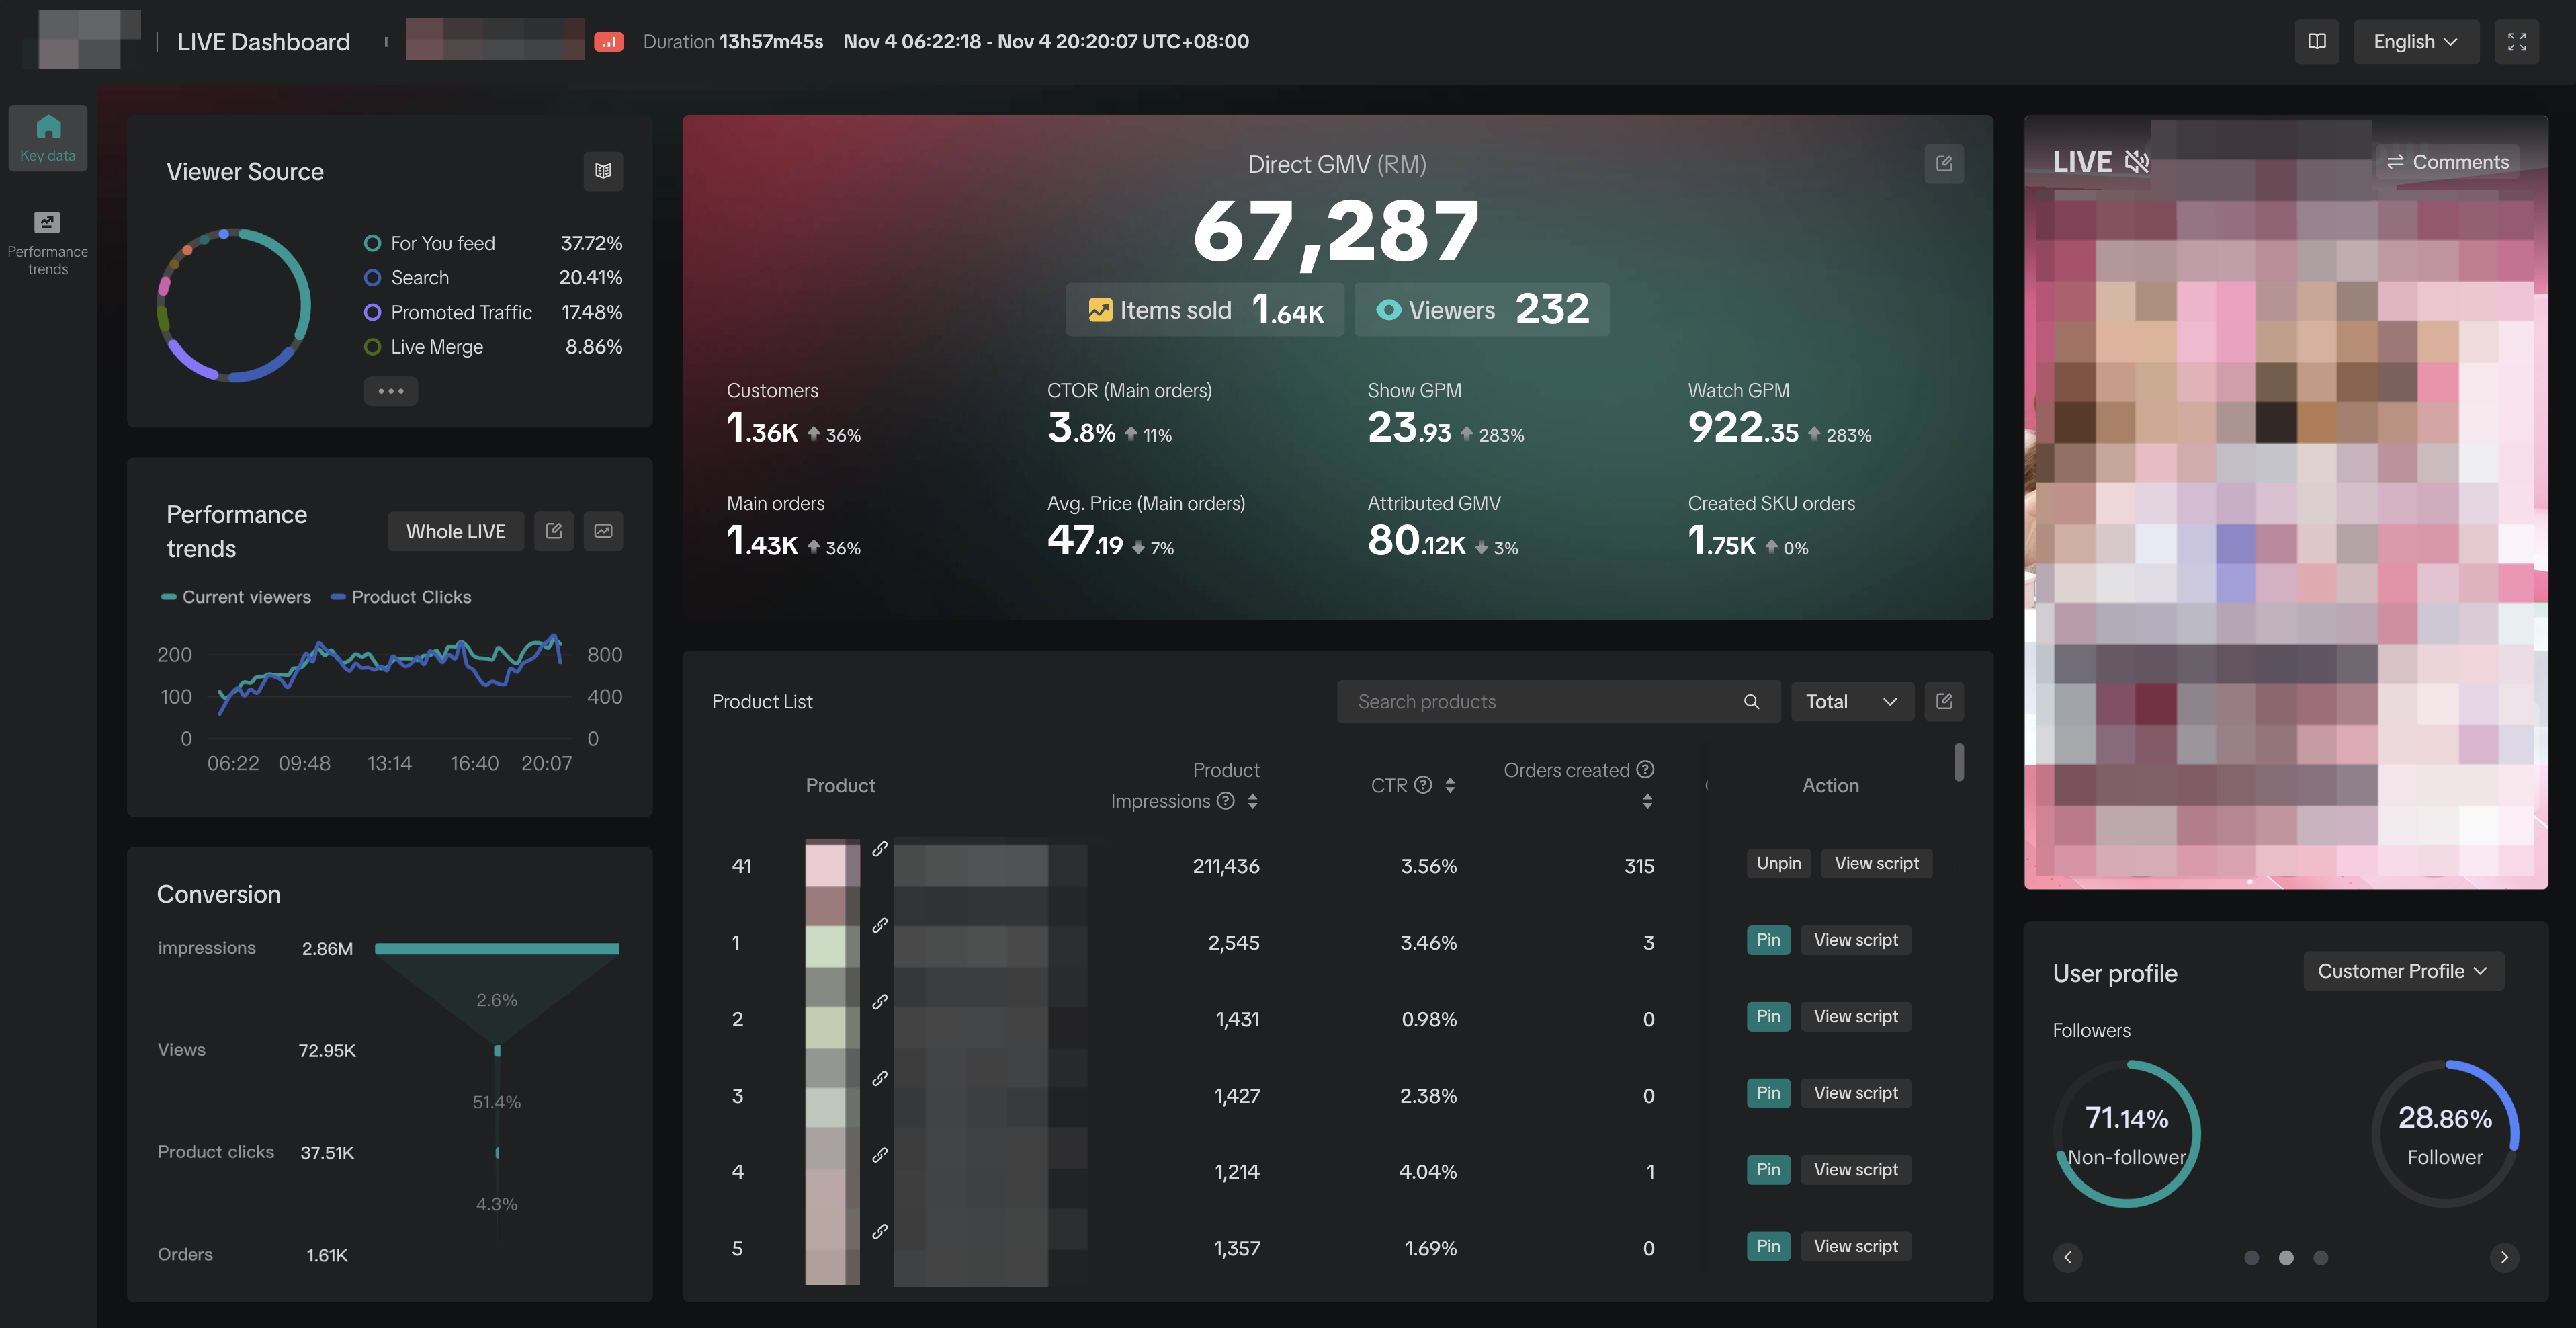 |
After LIVE completion
After your LIVE is completed, navigate to LIVE Analytics on LIVE Manager and select the individual LIVE room you wish to diagnose. Follow the trail below to be navigated to the LIVE dashboard.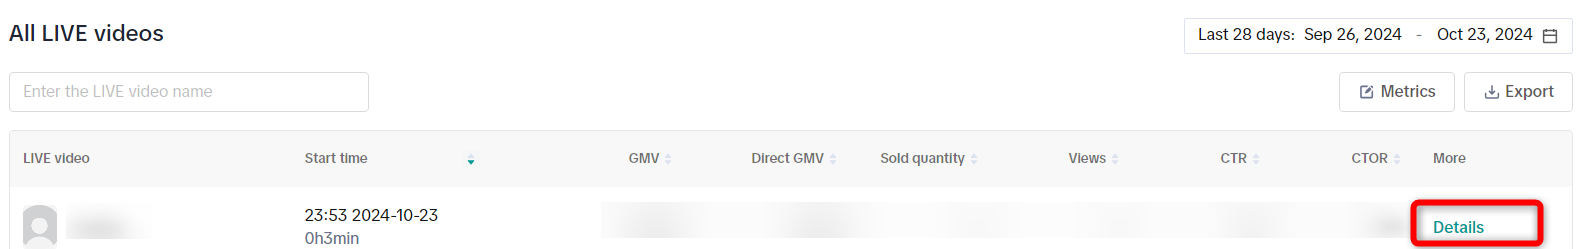 | 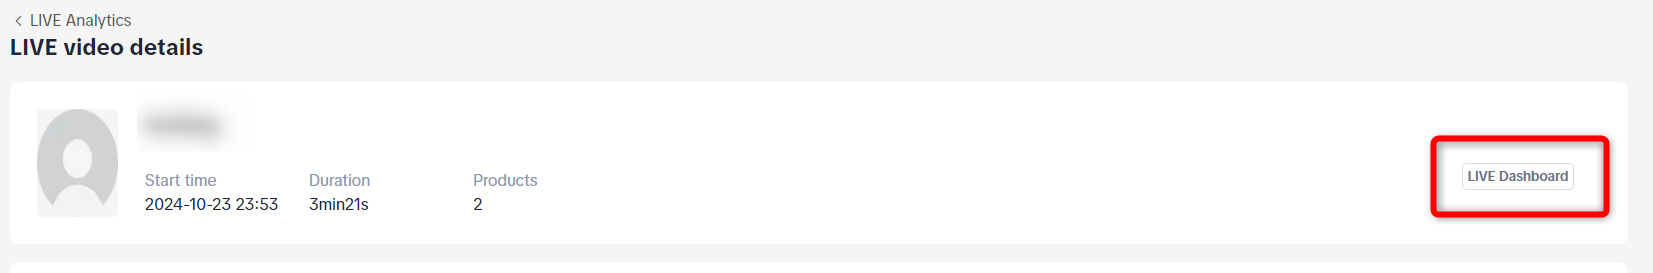 |

LIVE Dashboard Features
Room level actions
At the top right of the dashboard are a few action buttons.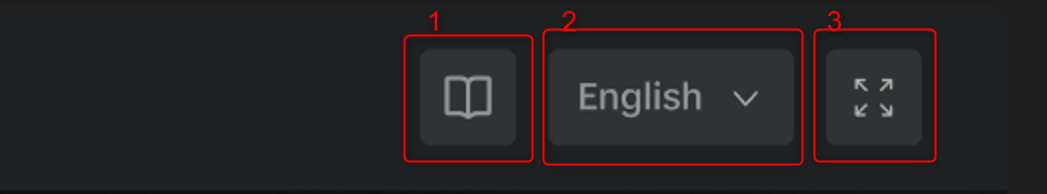
- User Manual: Click on this book icon to open the user manual and learn more on navigating the LIVE Dashboard
- Language: Select the language for the dashboard interface
- Full screen: Enlarge the dashboard to full-screen on your device
Key metrics tab
Please note: All images shown are for illustration purposes only, and the data presented is not real.| Module | Sample Interface | Description |
| Core data | 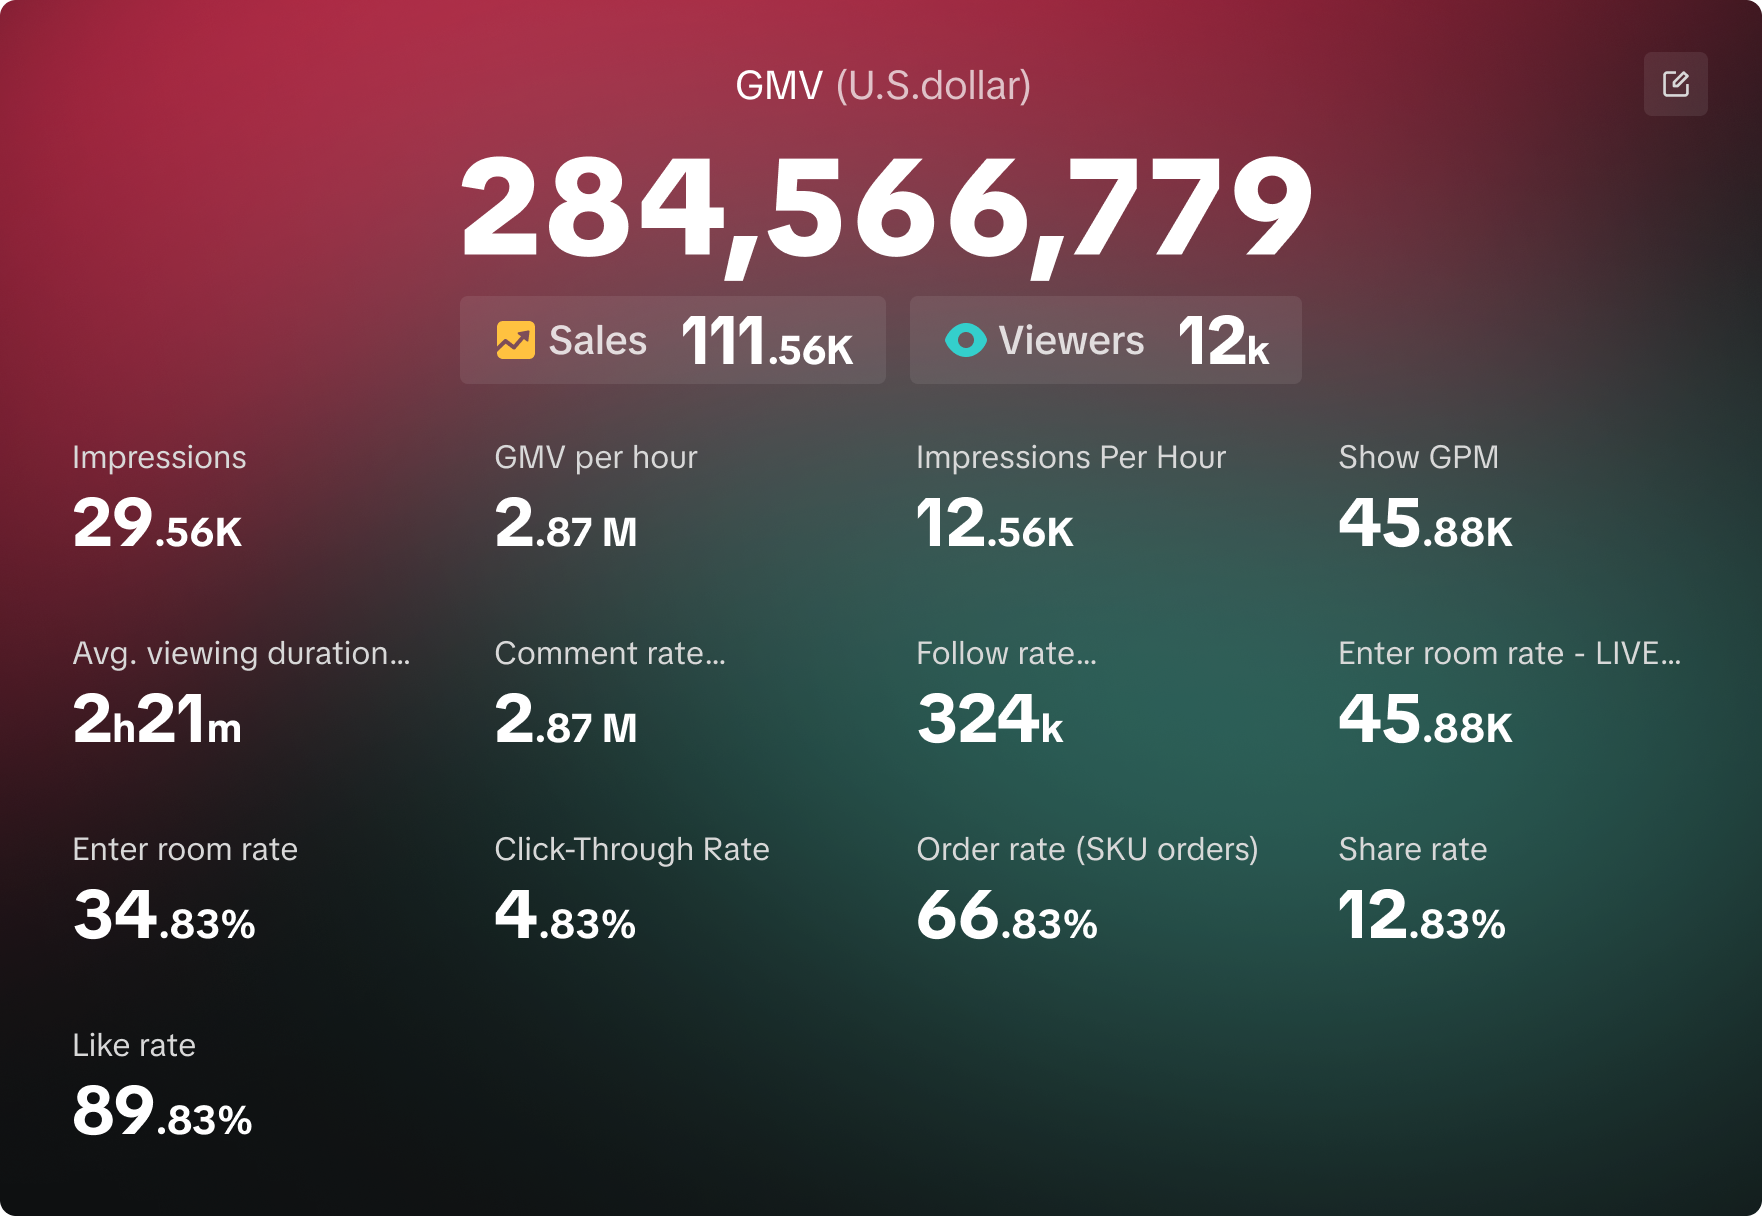 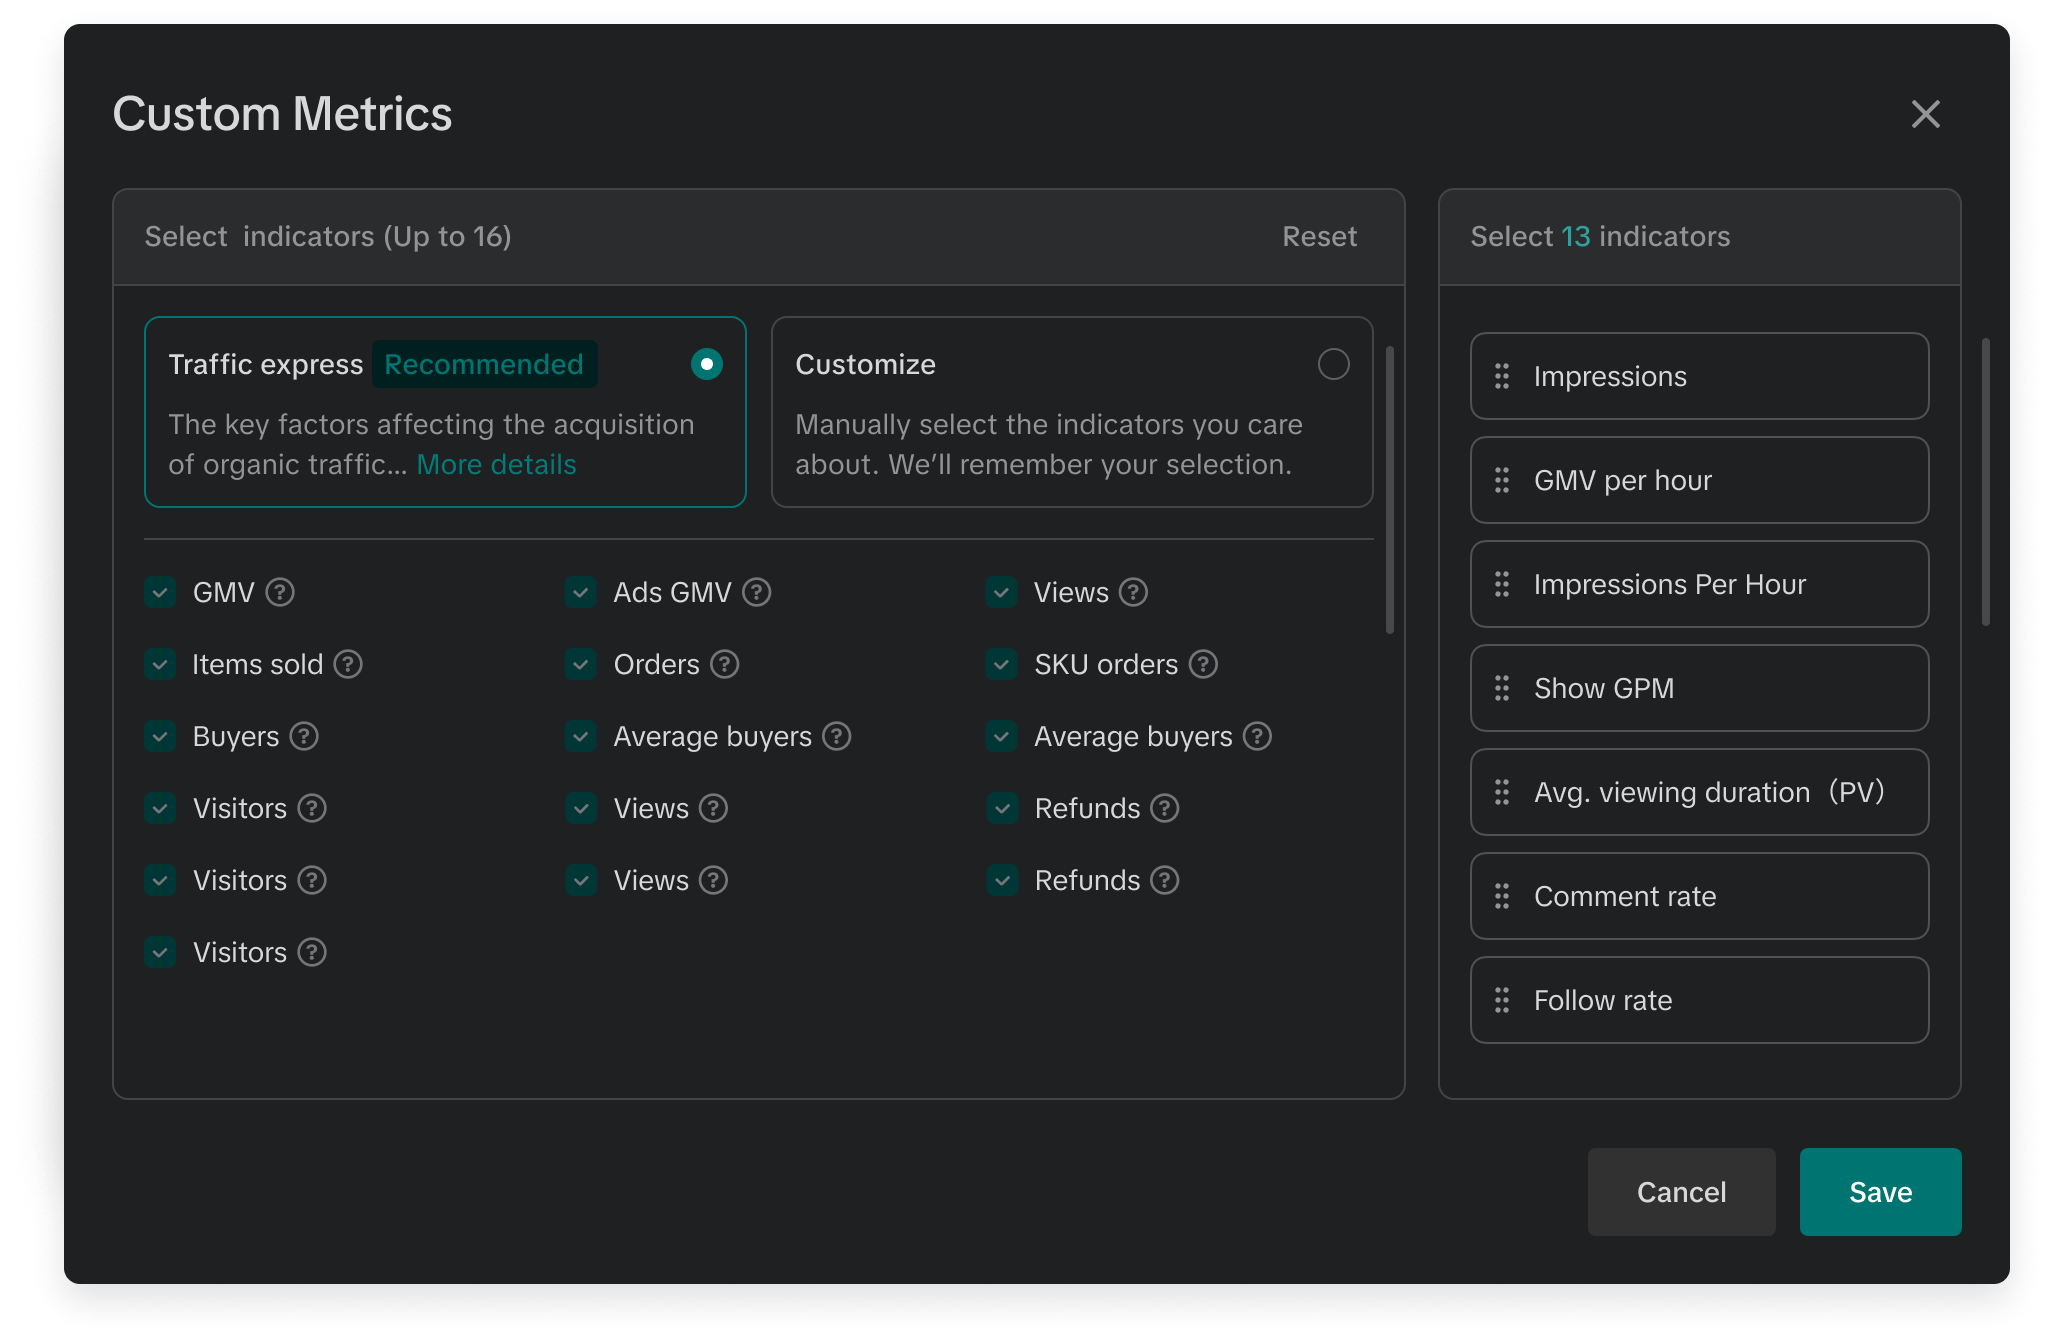 |
|
| Core data - metric benchmarks | During LIVE 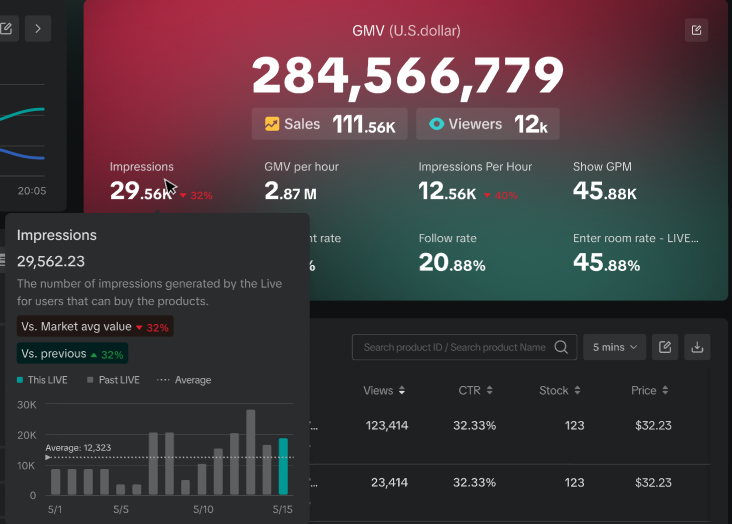 | The benchmark data functionality will vary on whether data is being viewed during the LIVE or after LIVE completionDuring LIVEDuring the LIVE, the 3 worst performing metrics will be visually highlighted (with red text) signifying the deviation of the metric from the average market value**.After LIVEAfter the LIVE, users will also be able to hover on any of the 3 worst performing metrics to get a trend chart displaying the metric performance in comparison to historical market average and across all their past LIVEs in the last 14 days. This allows users to track how the metric performed with respect to their own historical performance.**Average market value considers all LIVE Creators in the same geographical market, regardless of category type. |
| Performance trends | 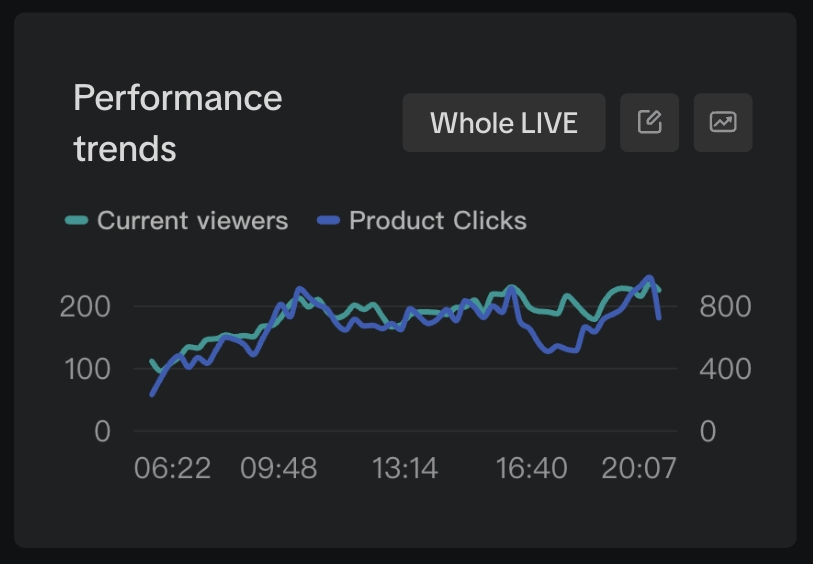 |
|
| Traffic source | 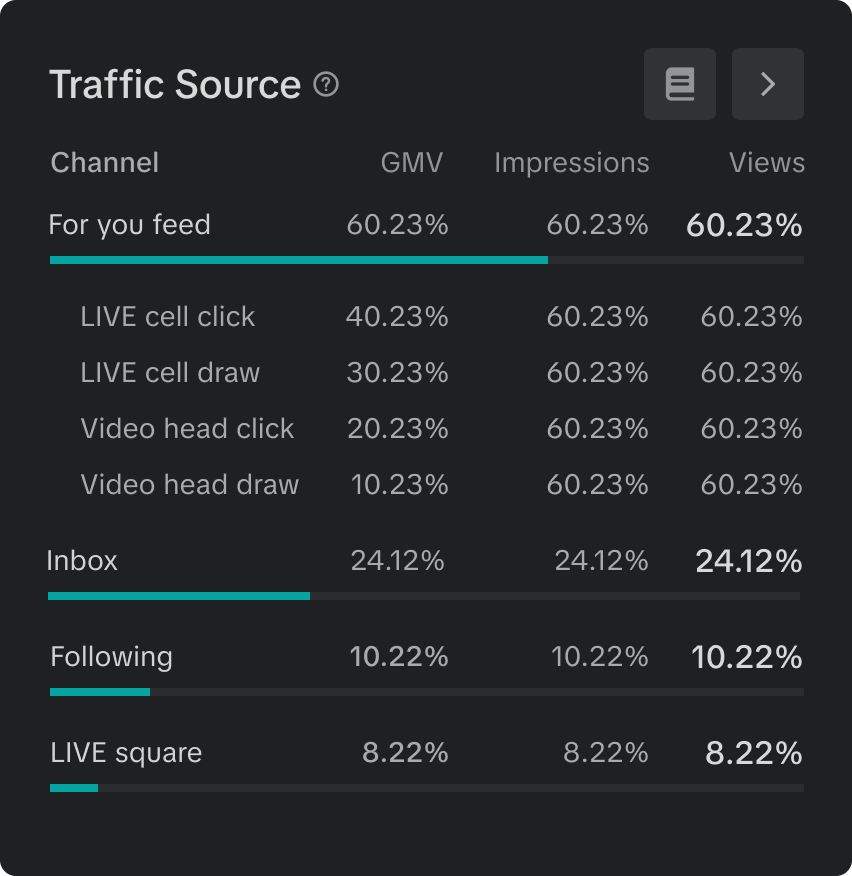 |
|
| Follower analytics | 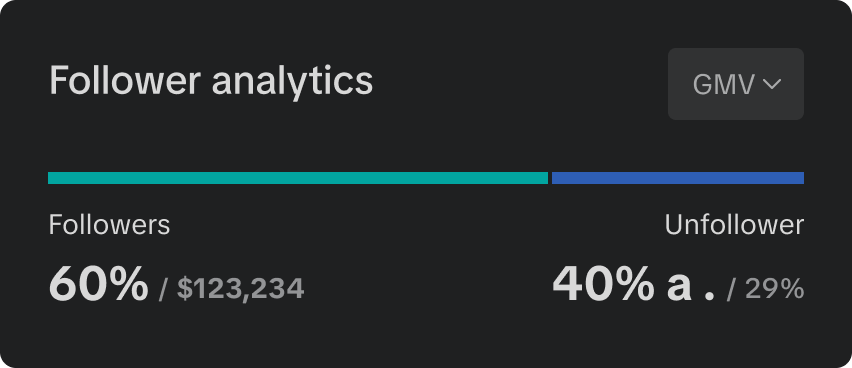 |
|
| Product List | 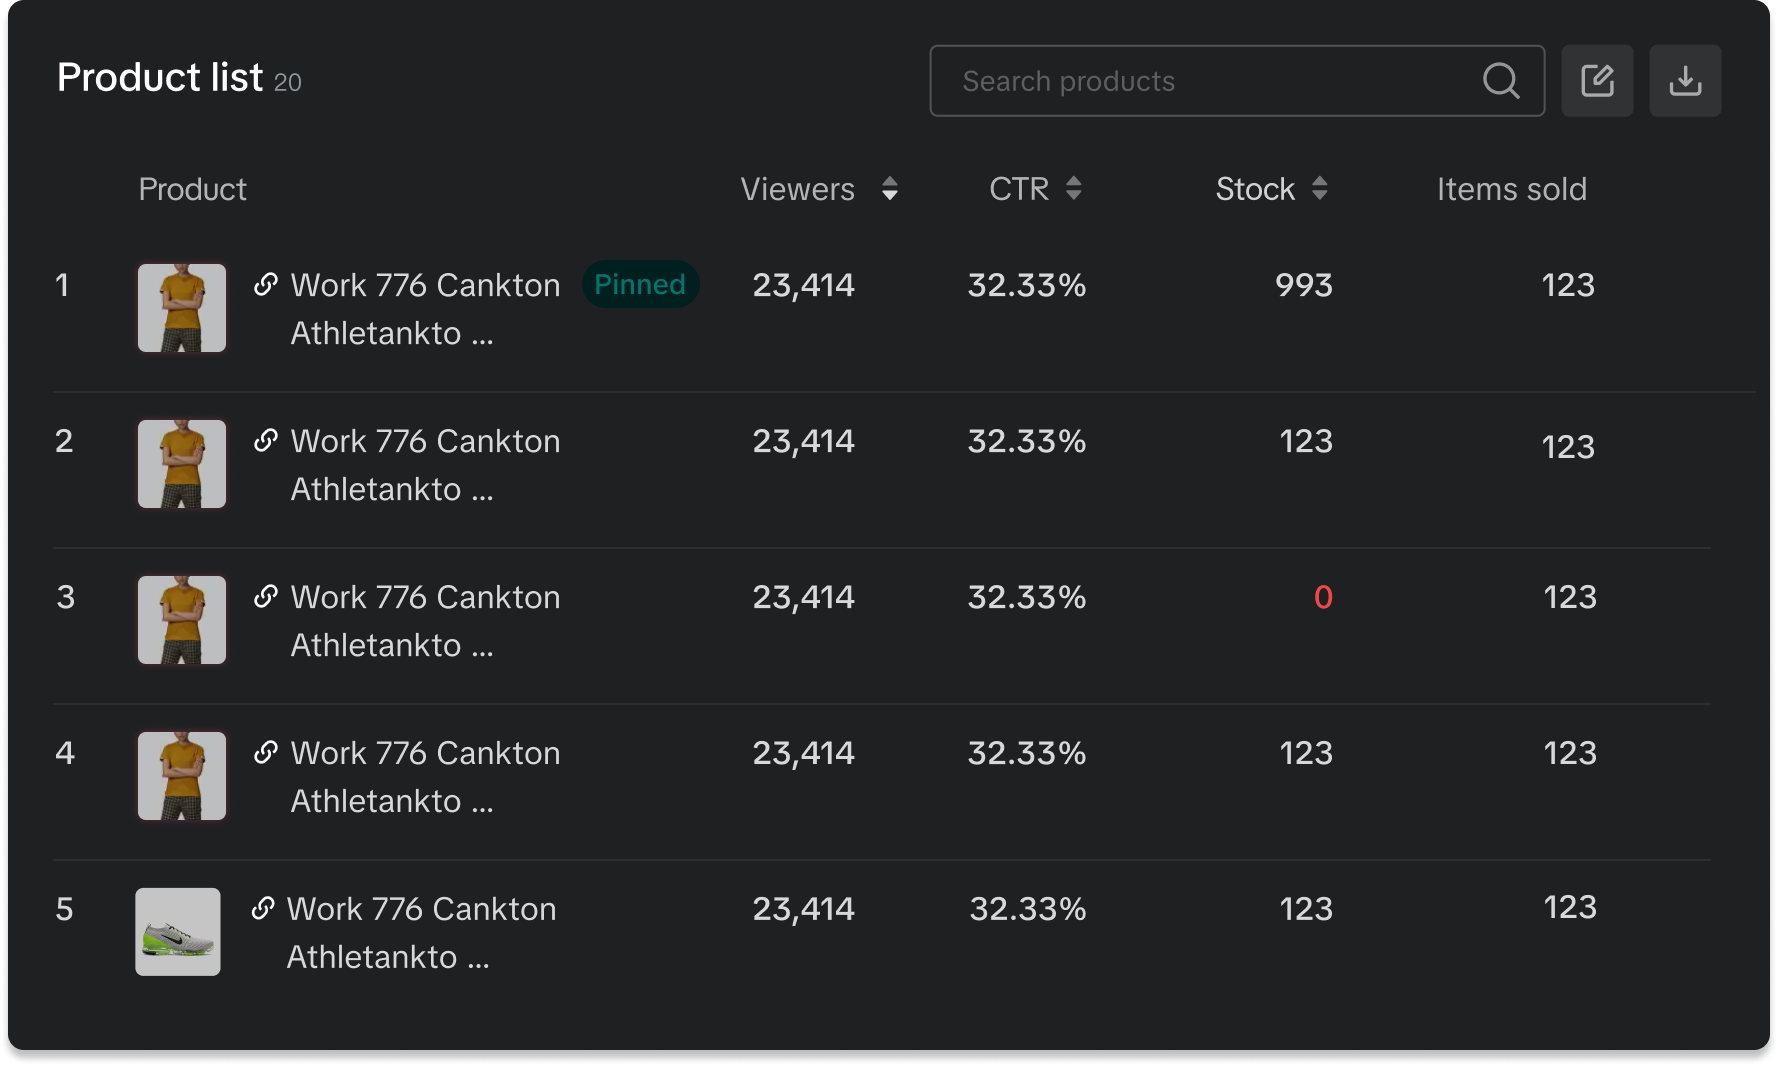 |
|
| LIVE Replay |  |
|
| User profile | 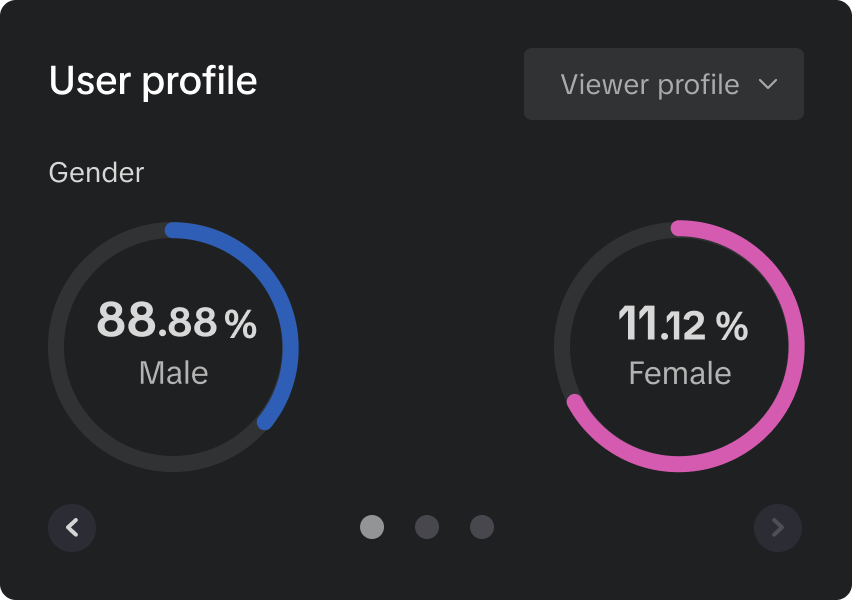 |
|
Performance trends tab
Please note: All images shown are for illustration purposes only, and the data presented is not real.| Module | Sample Interface | Description |
| Performance trends overview | 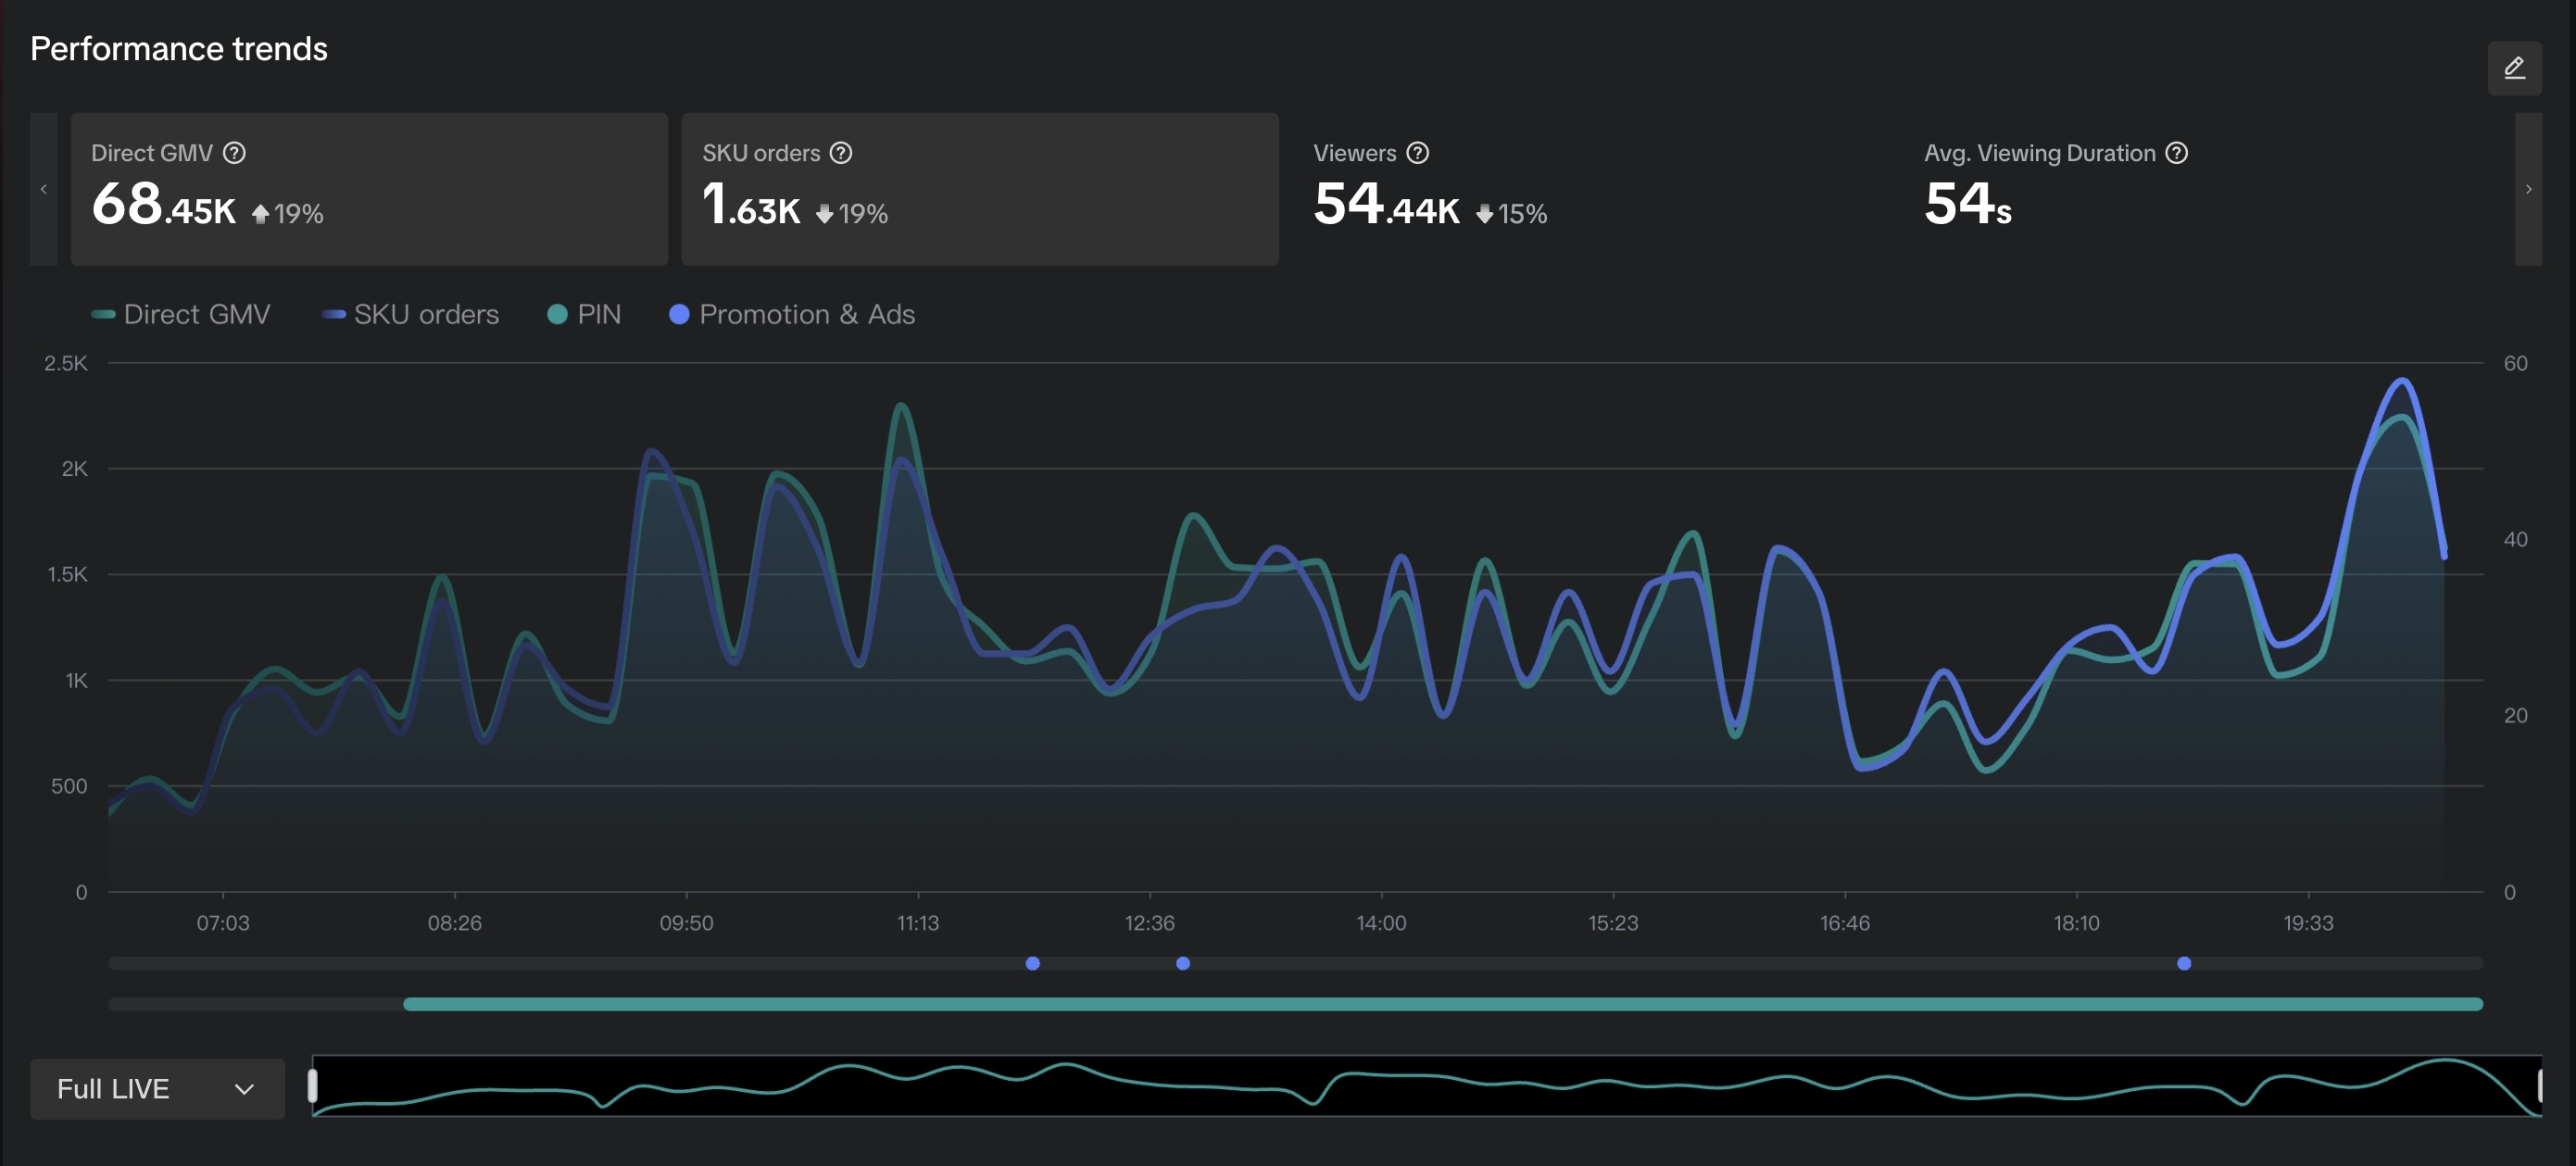 |
|
| Product information | 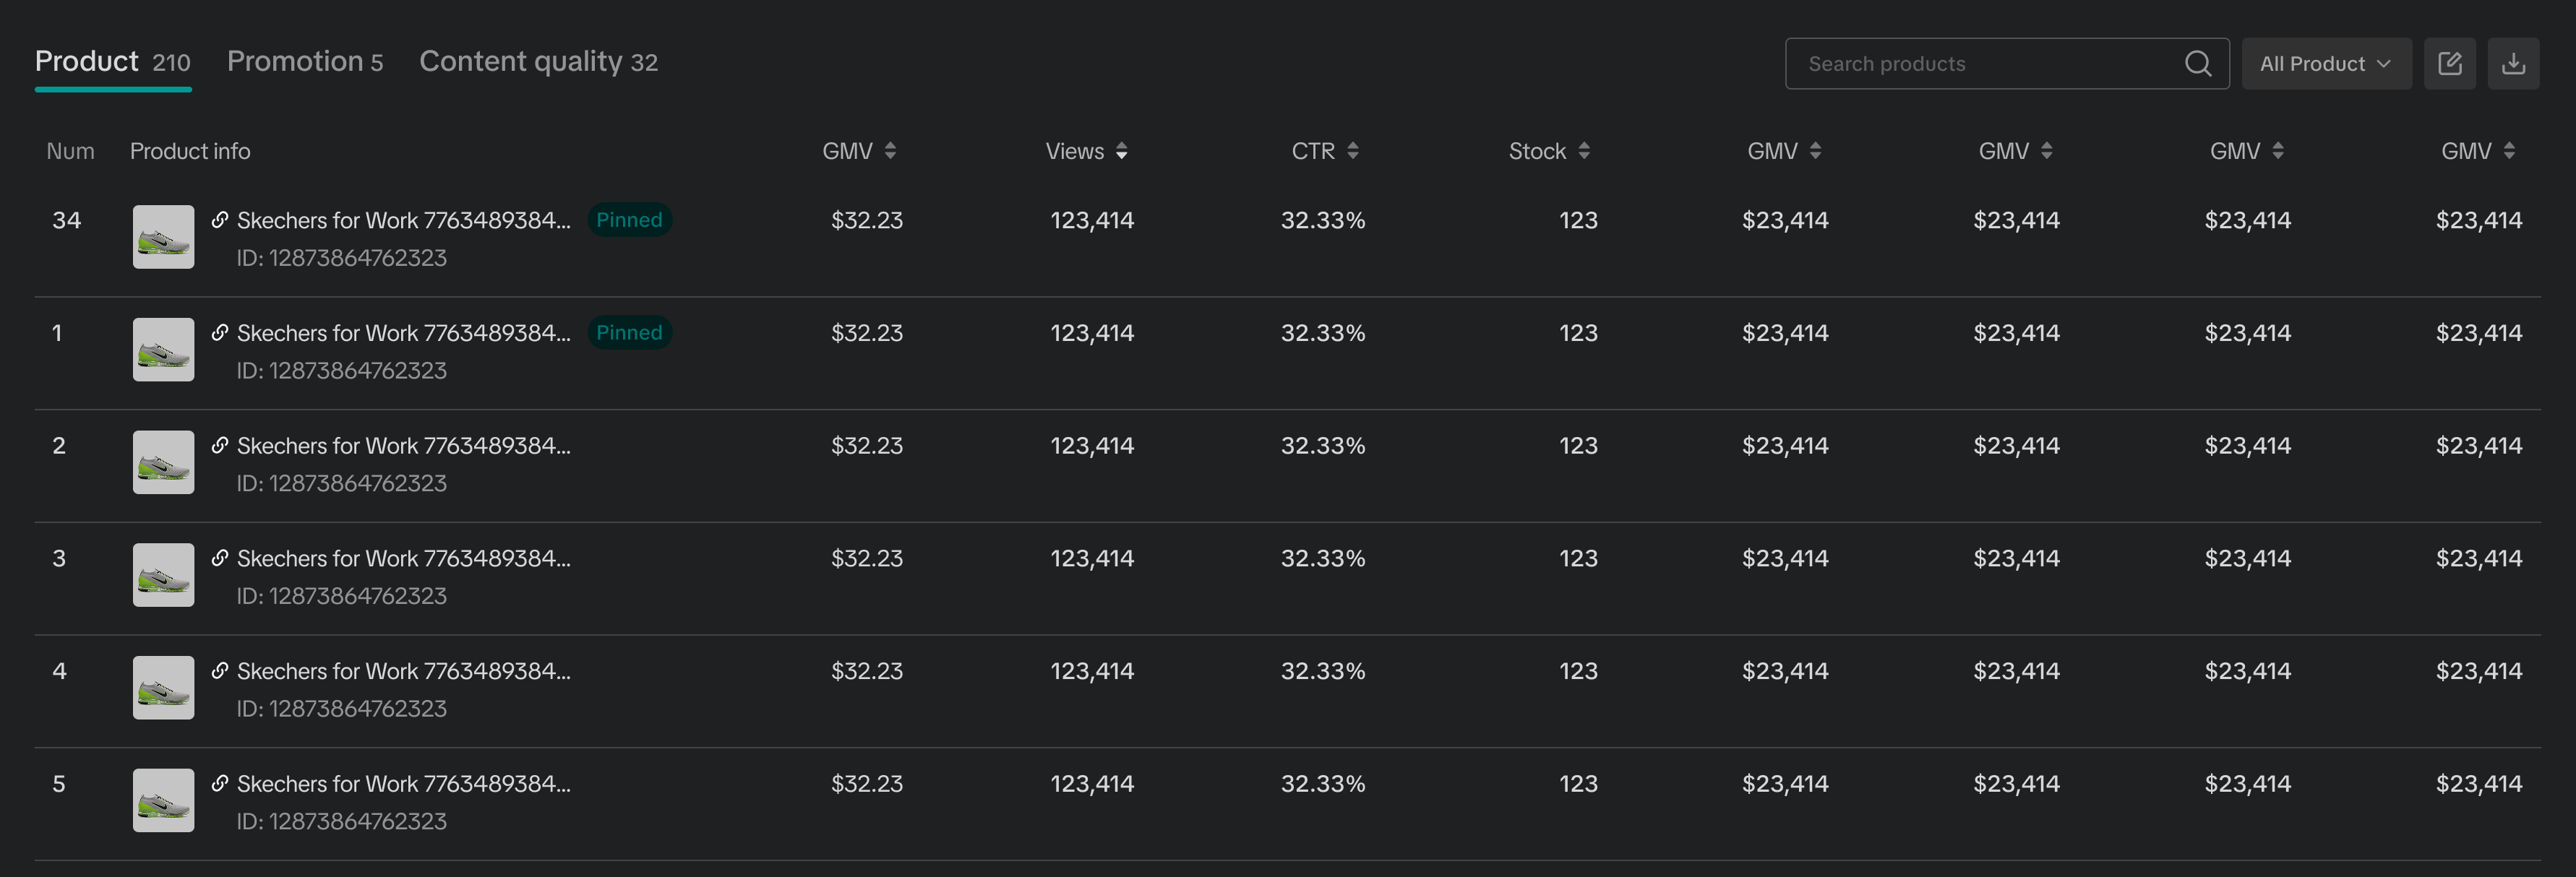 |
|
| Promotion information | 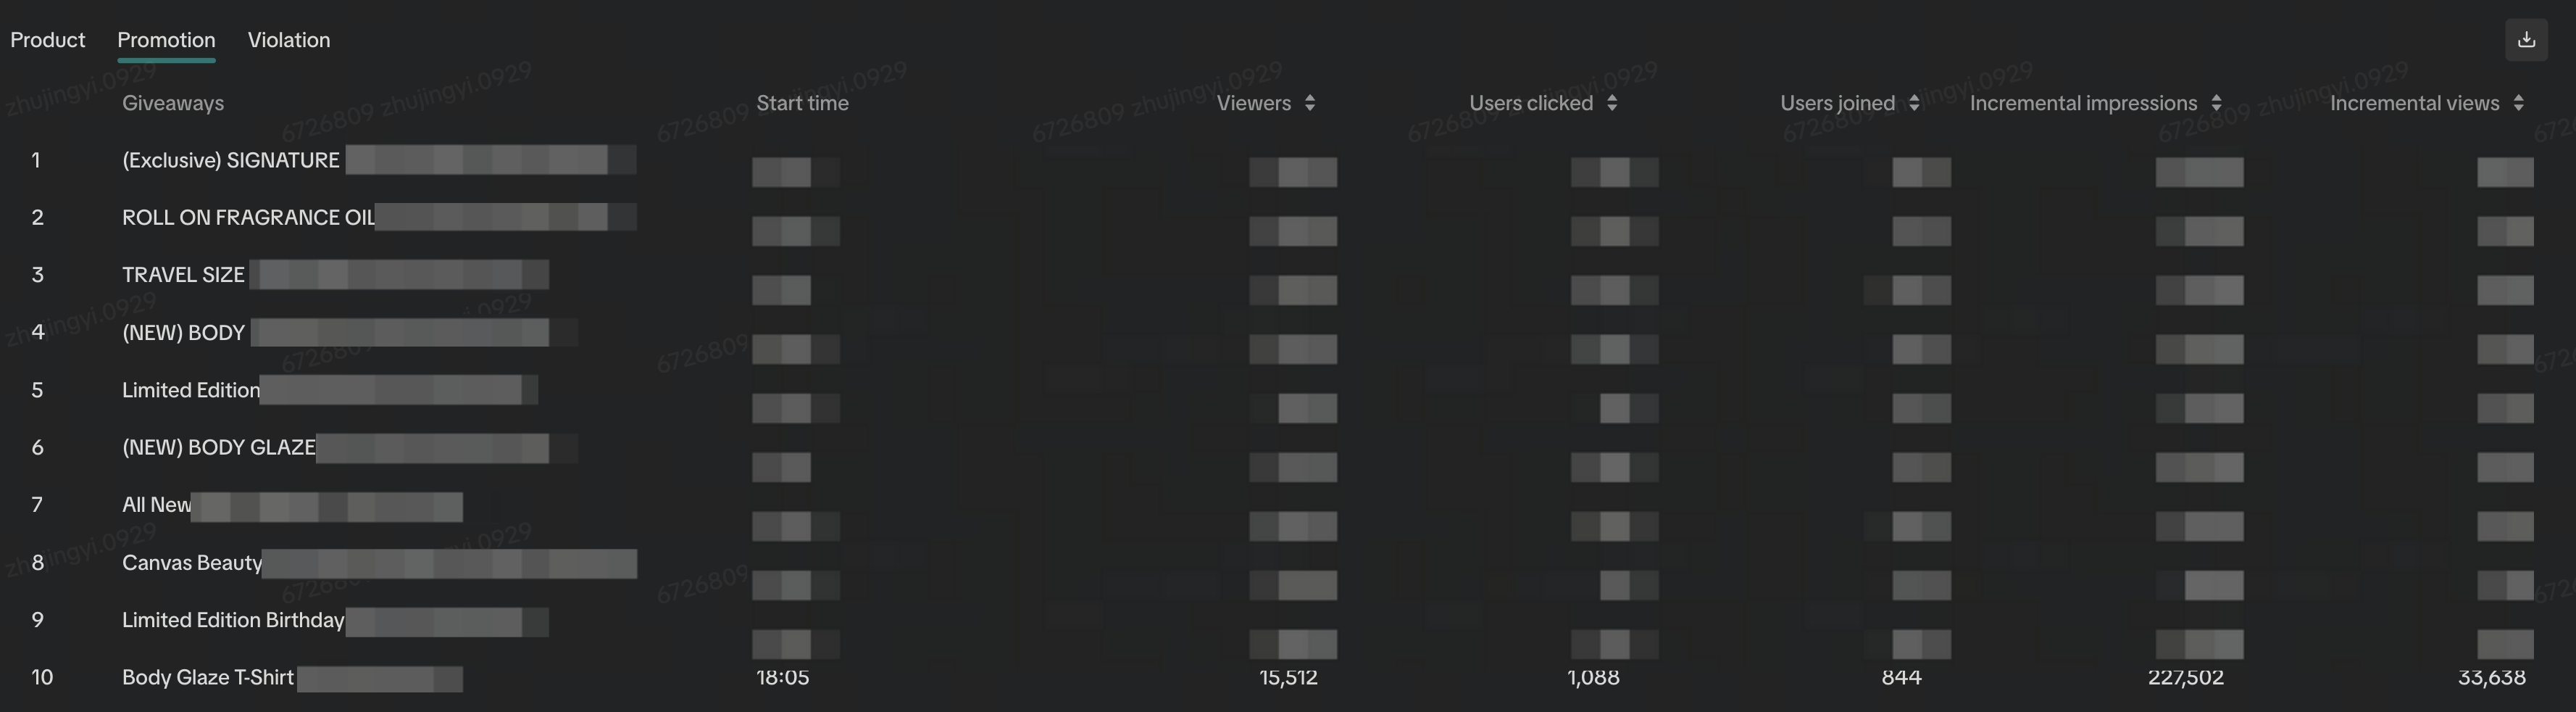 |
|
| Content quality | 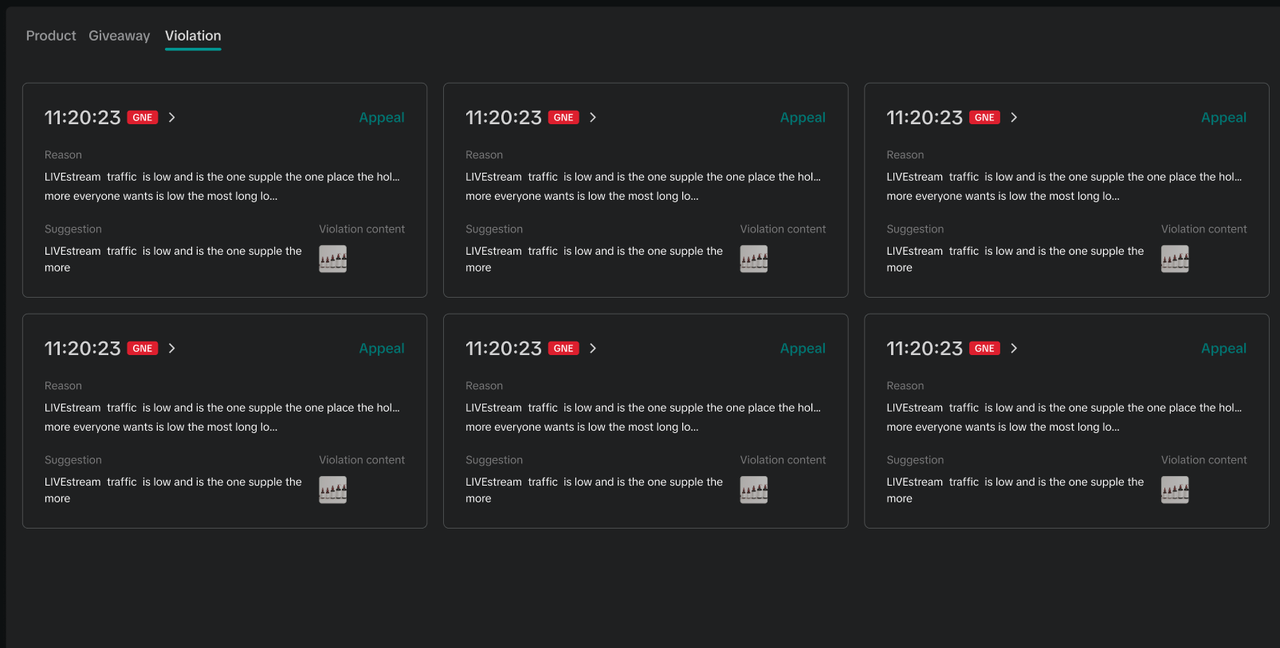 |
|
| LIVE Replay |  |
|
Traffic source tab
Please note: All images shown are for illustration purposes only, and the data presented is not real.| Module | Sample Interface | Description |
| Traffic source breakdown | 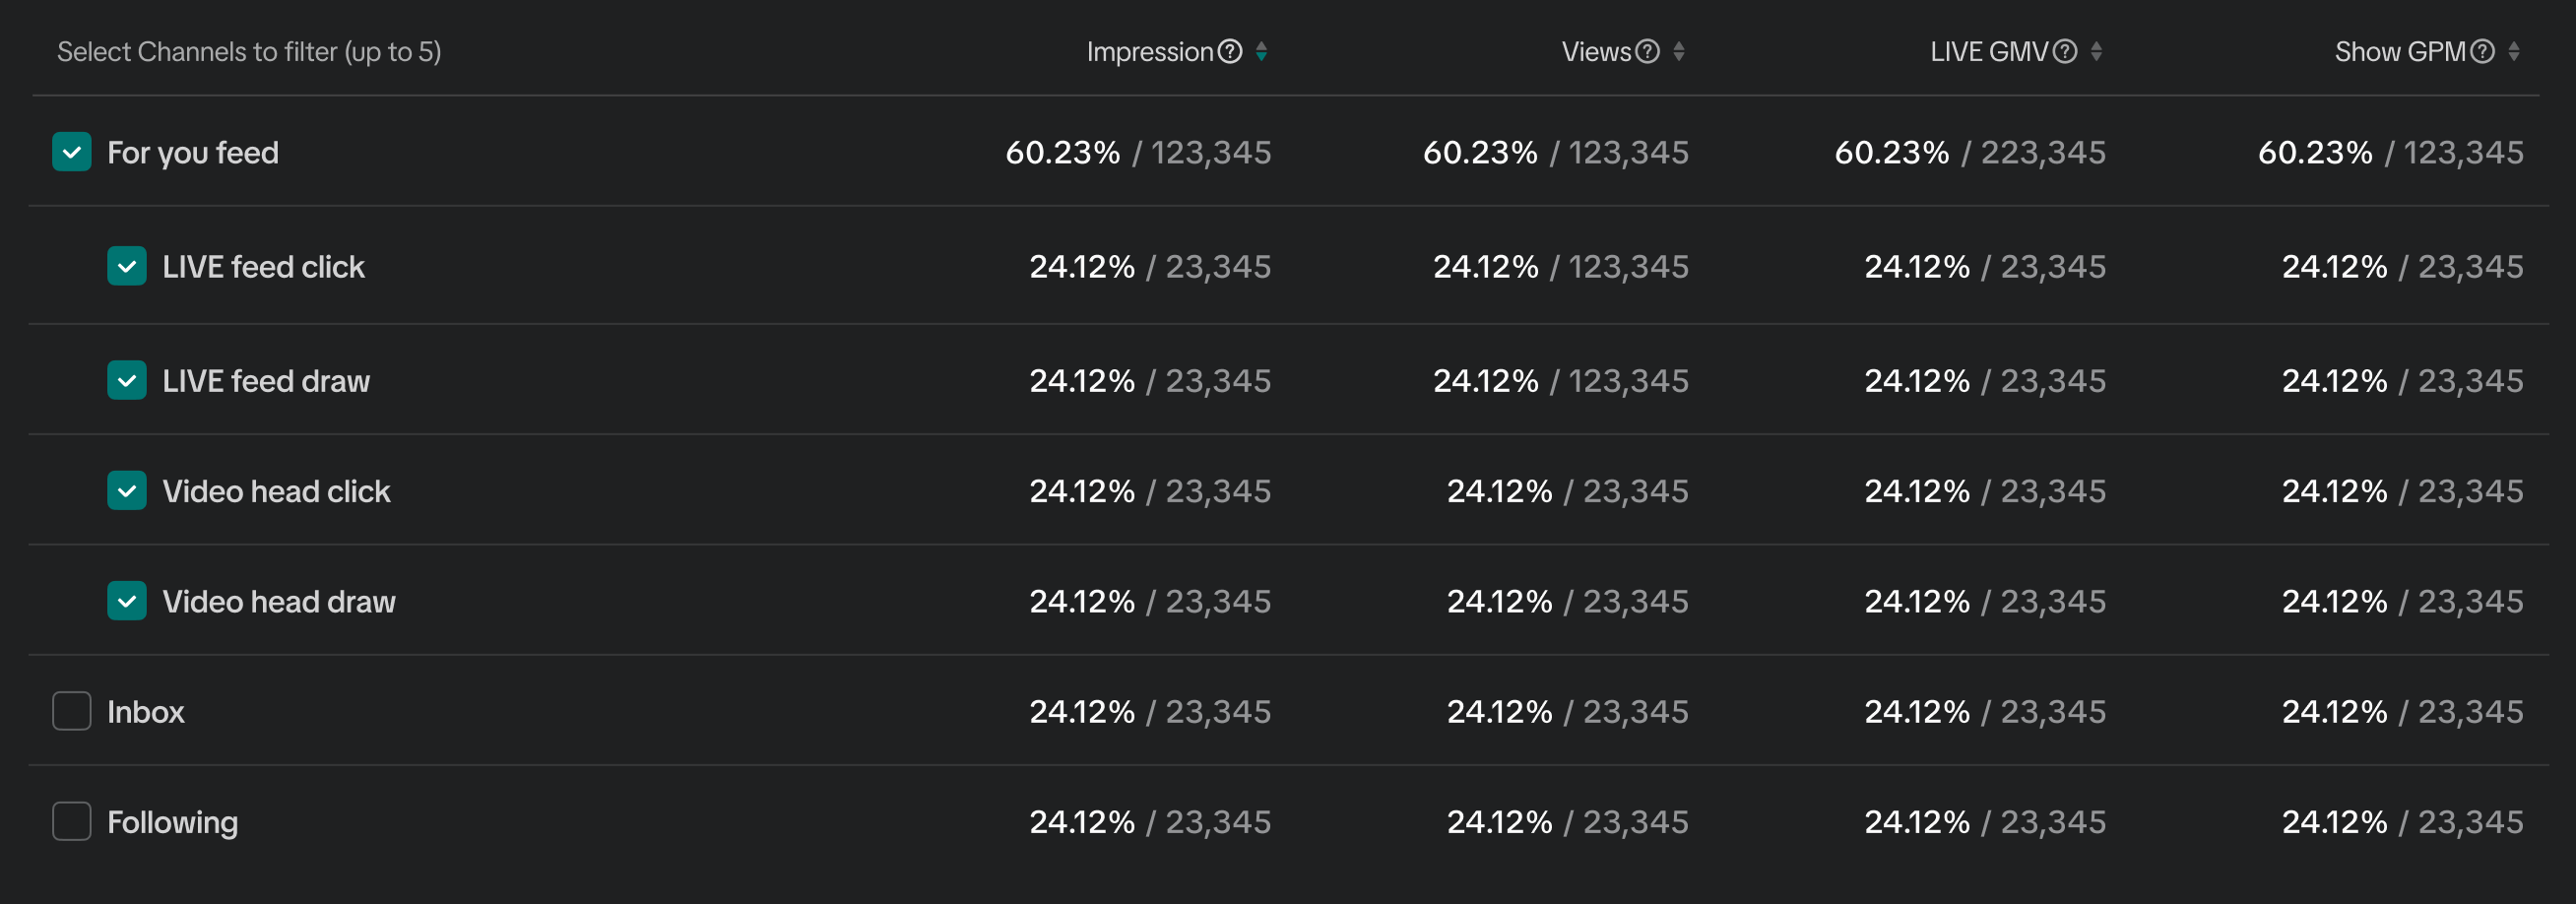 |
|
| Traffic source trend chart | 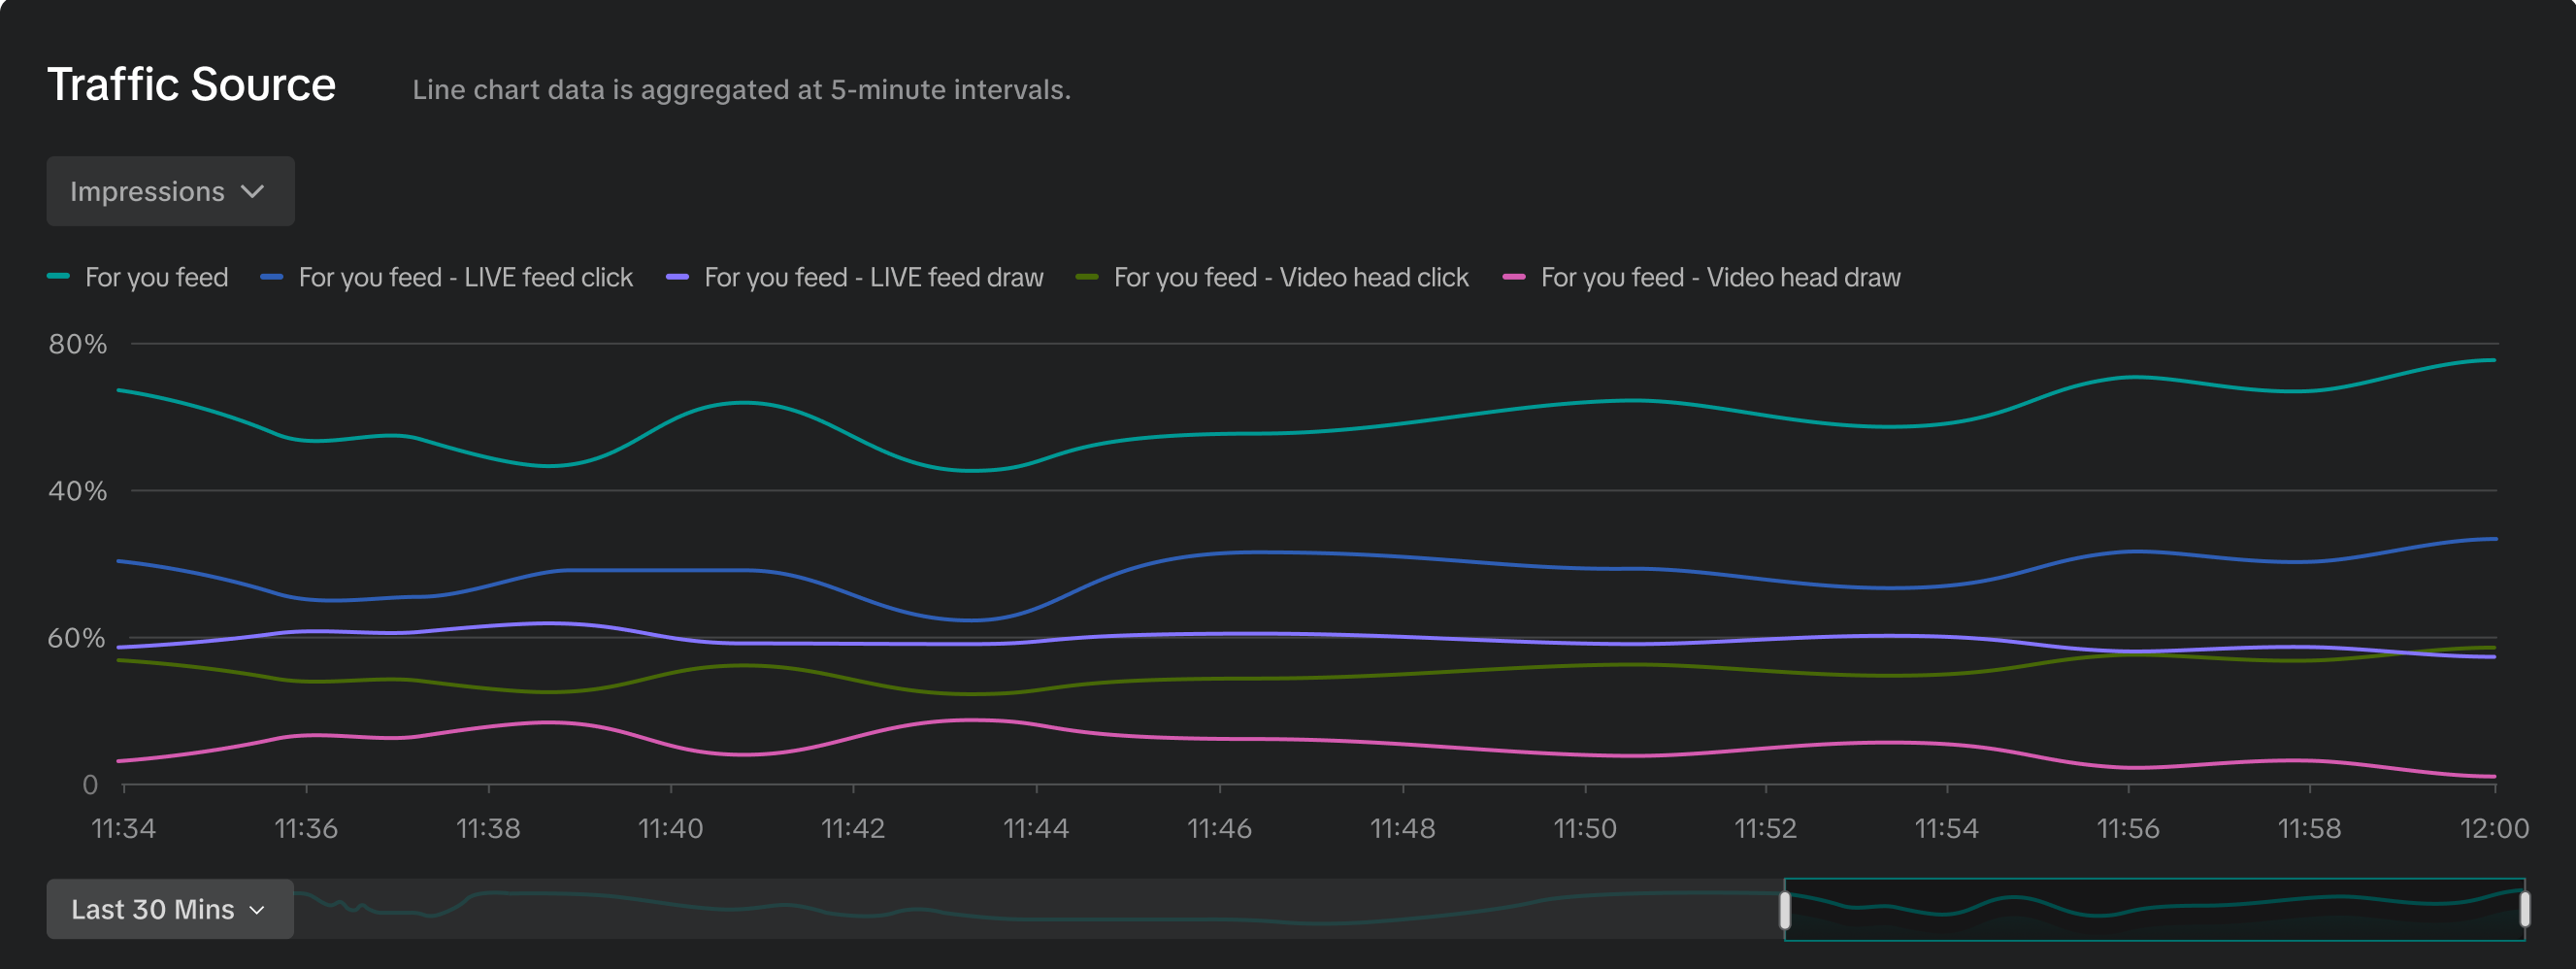 |
|
| Video traffic to LIVE |  |
|
| LIVE Replay | 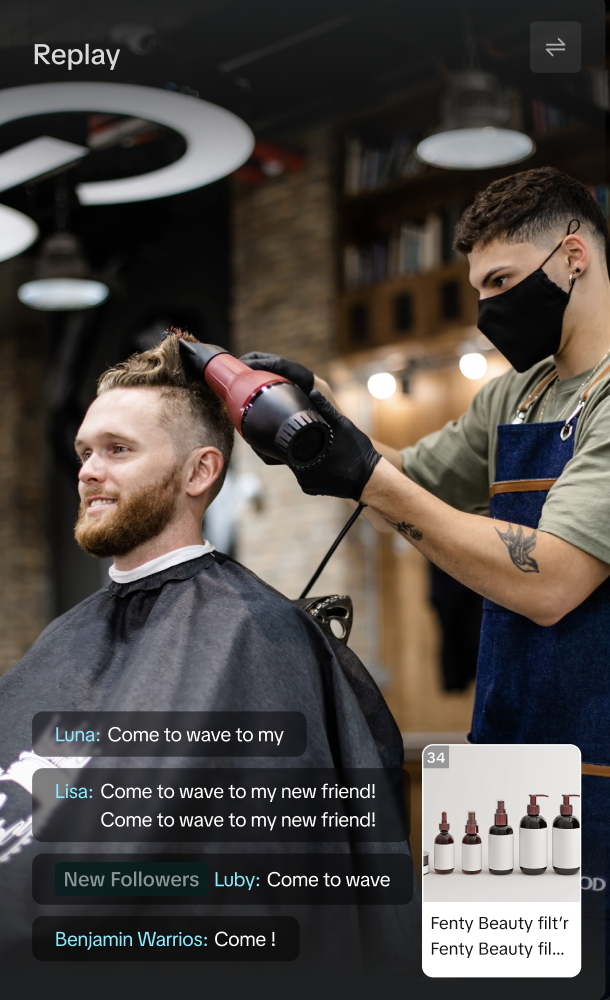 |
|

Frequently Asked Questions (FAQs)
- Do I need any special access or permissions to access this unified LIVE dashboard?
- What interface (PC/APP) will this functionality be available on?
Anda mungkin juga tertarik

Analyzing Livestream Data for Creators
This article will show you how to navigate to the LIVE & LIVE Details page via Creator App to utilis…

LIVE Performance
Attention: Please note that the GMV attribution on Seller-related transactions has been changed to C…

LIVE Diagnosis
This article explains LIVE Diagnosis feature overview and how sellers can better prepare for your ne…