

Analyzing Livestream Data for Creators
05/02/2025
This article will show you how to navigate to the LIVE & LIVE Details page via Creator App to utilise the data available, empowering you with insights to continue improving your upcoming livestreams.
Highlights

Highlights
- Gain insight into your top performing LIVEs and understand which products drive the highest revenue
- Understand your audience demographics to tailor your content better in suiting their needs
- Analyse how audiences engage with you during your LIVEs, in terms of new followers, comments & shares

Checking LIVE Performance via Creator Data (on App)
Please note that all images are for illustration purposes only and may vary slightly from the actual interface.| Explanation | Interface | |
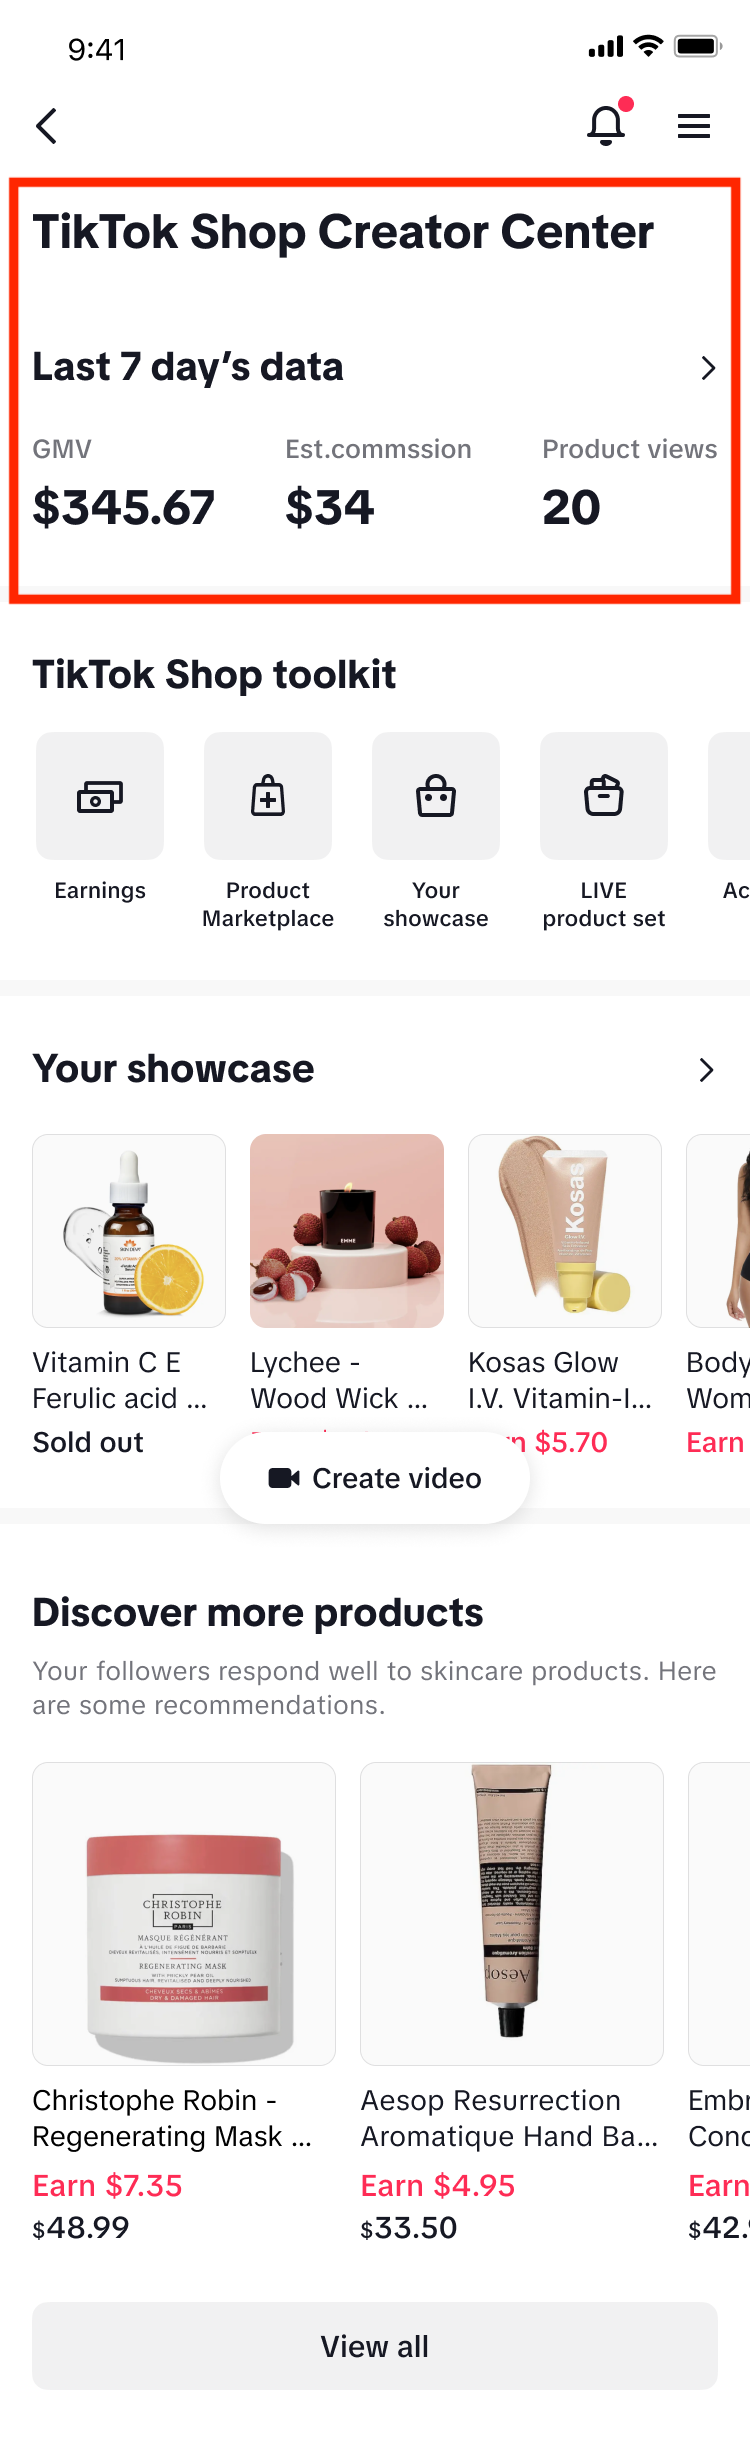
Navigate to: TikTok Shop Creator Center > Last 7 day's data Last 7 days dataHere you can get an overview of the last 7 days data which will provide you with GMV (valor bruto de la mercancía), Est commission and product view metrics. If you click on this section, you will open the Creator Data page. Note:
|  | |
| 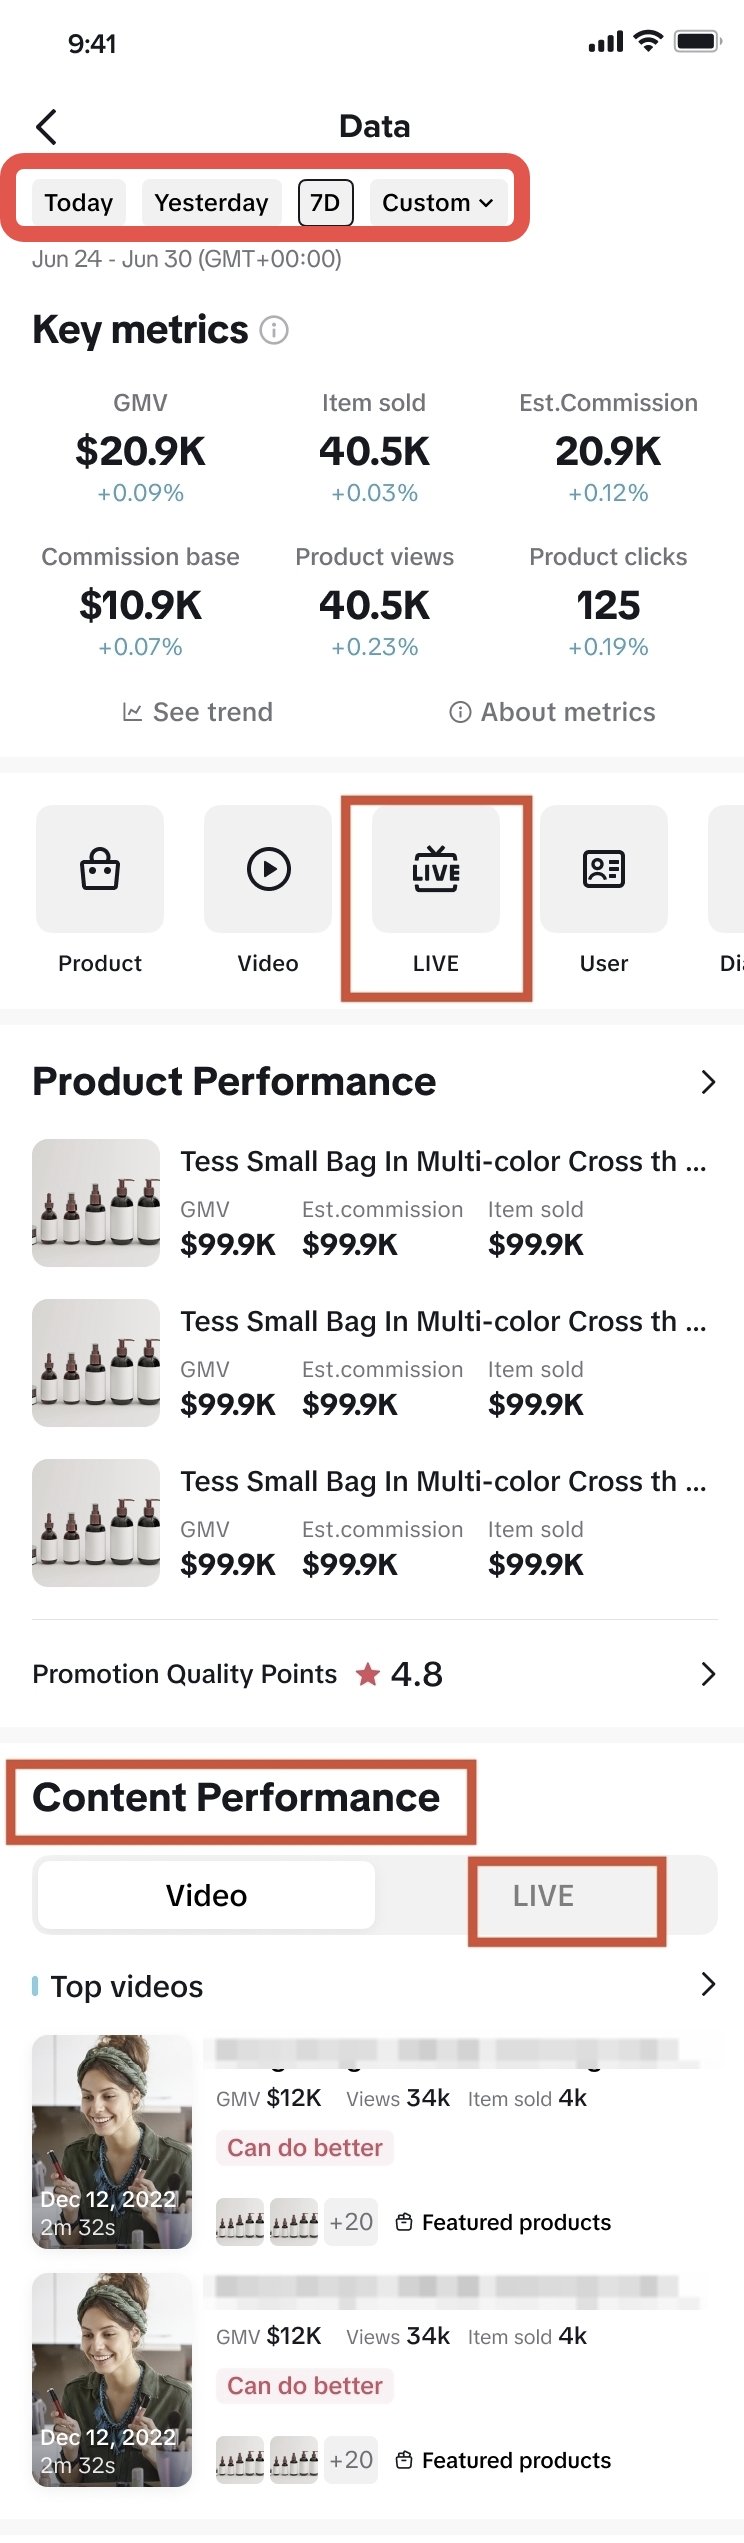 Creator Data page | 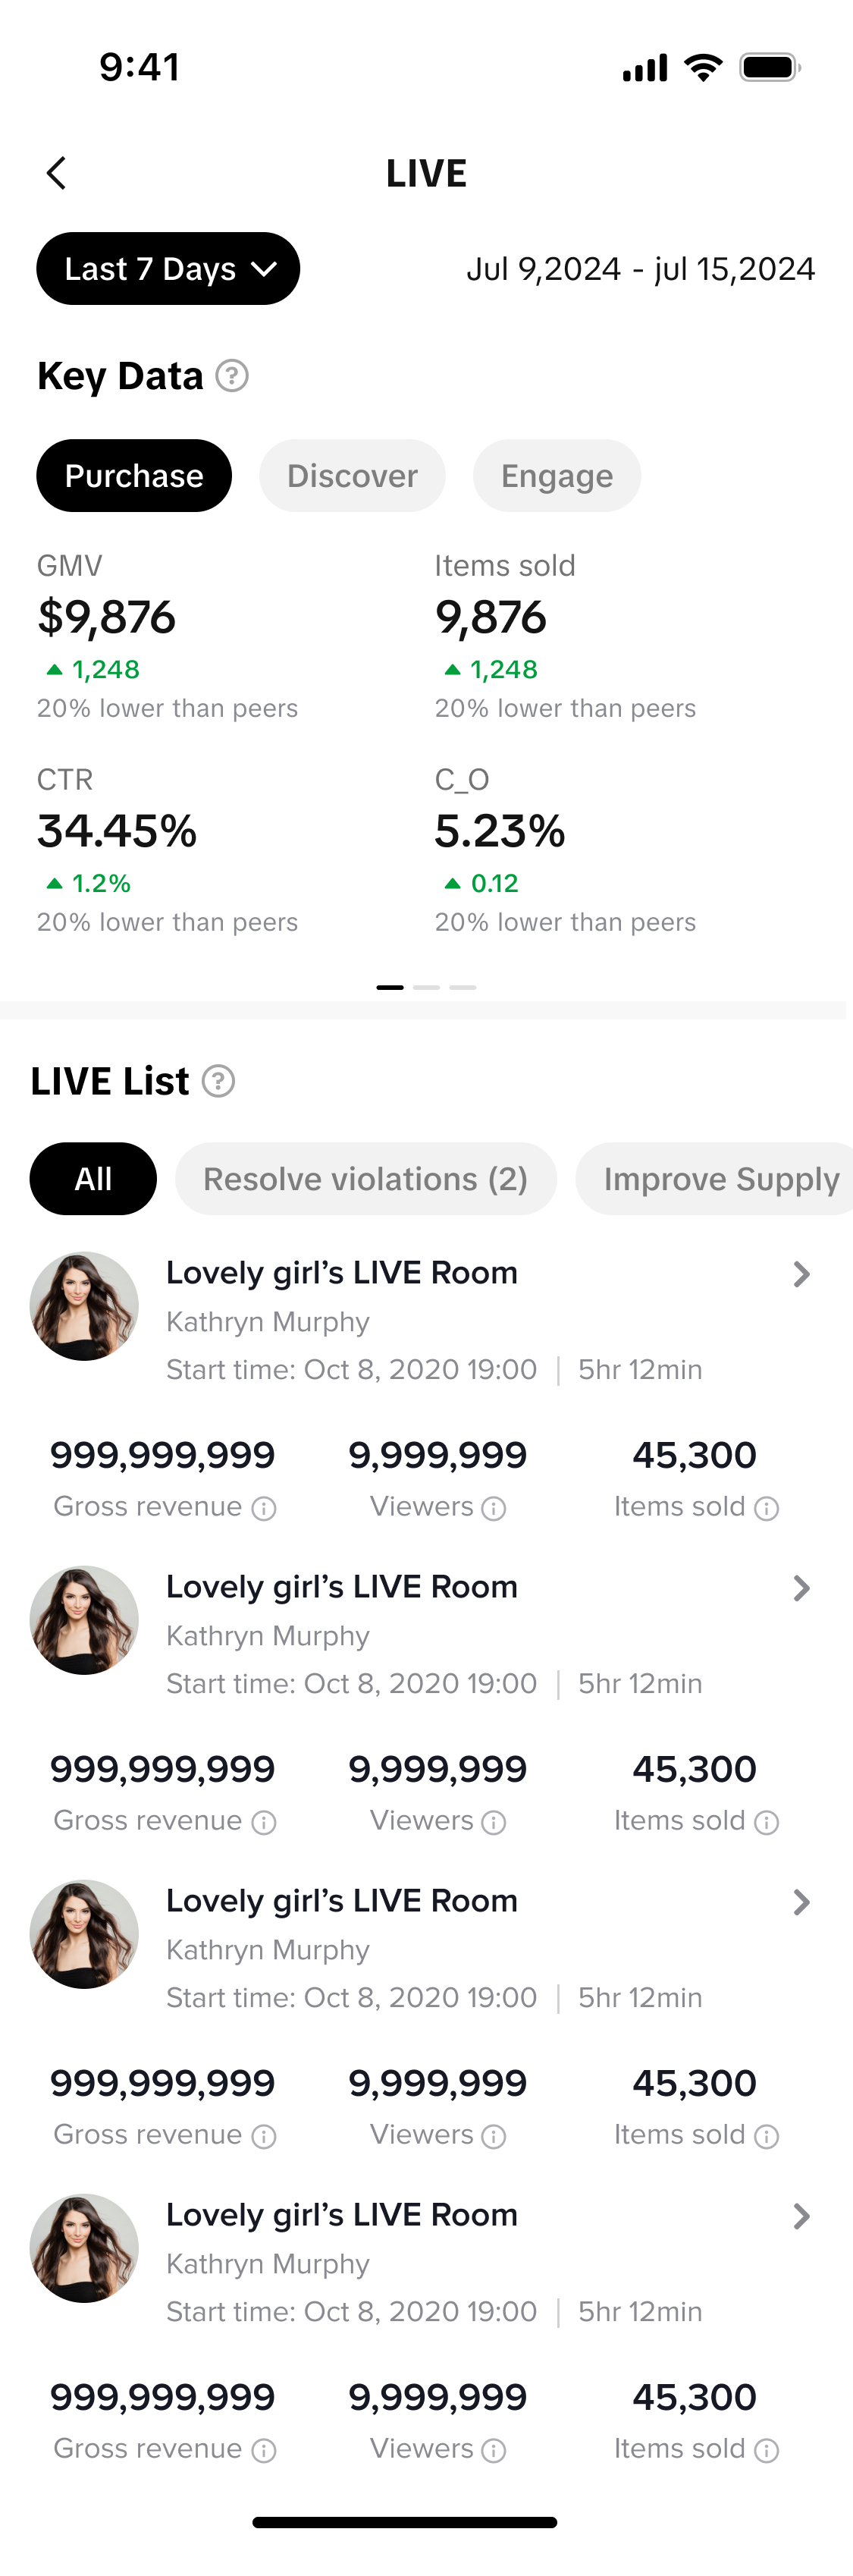 LIVE Page |
LIVE Page
| 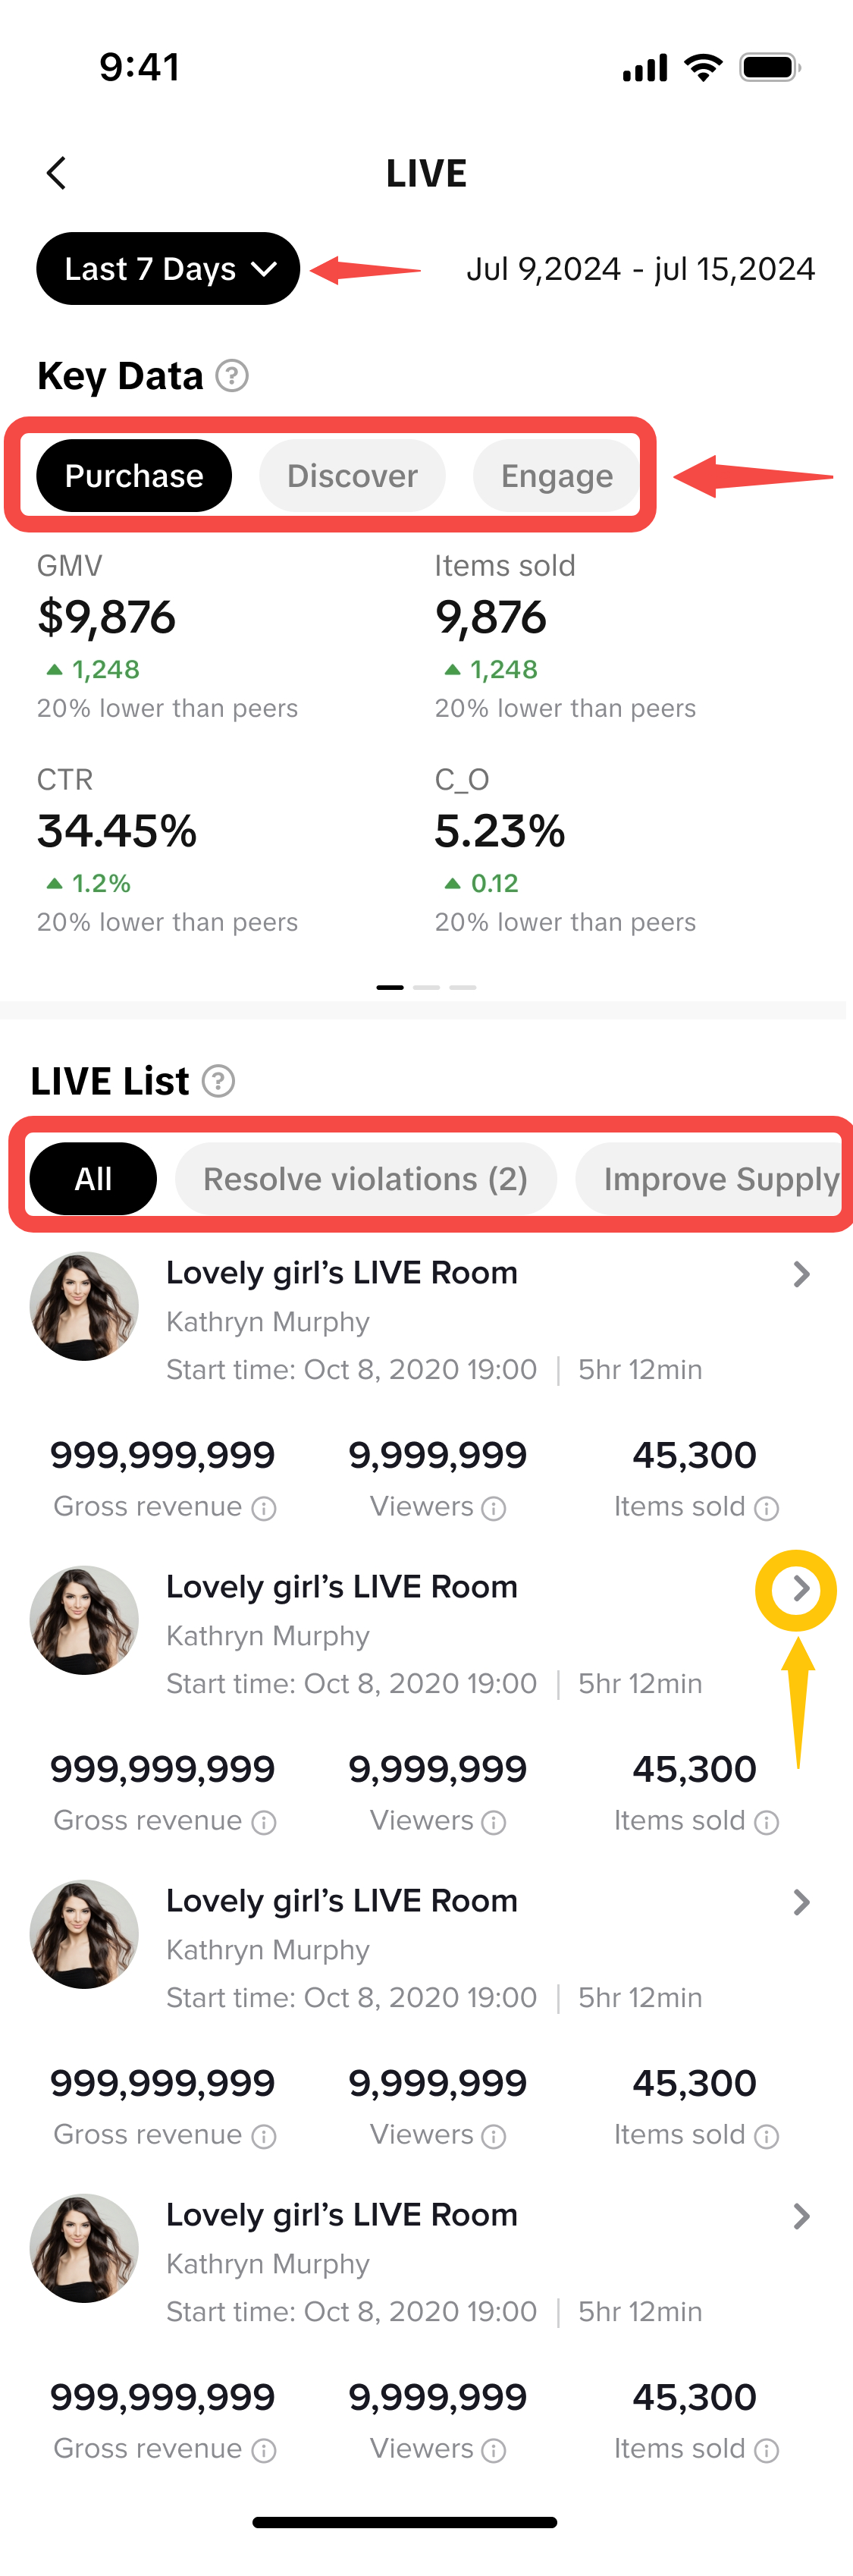 LIVE Page | 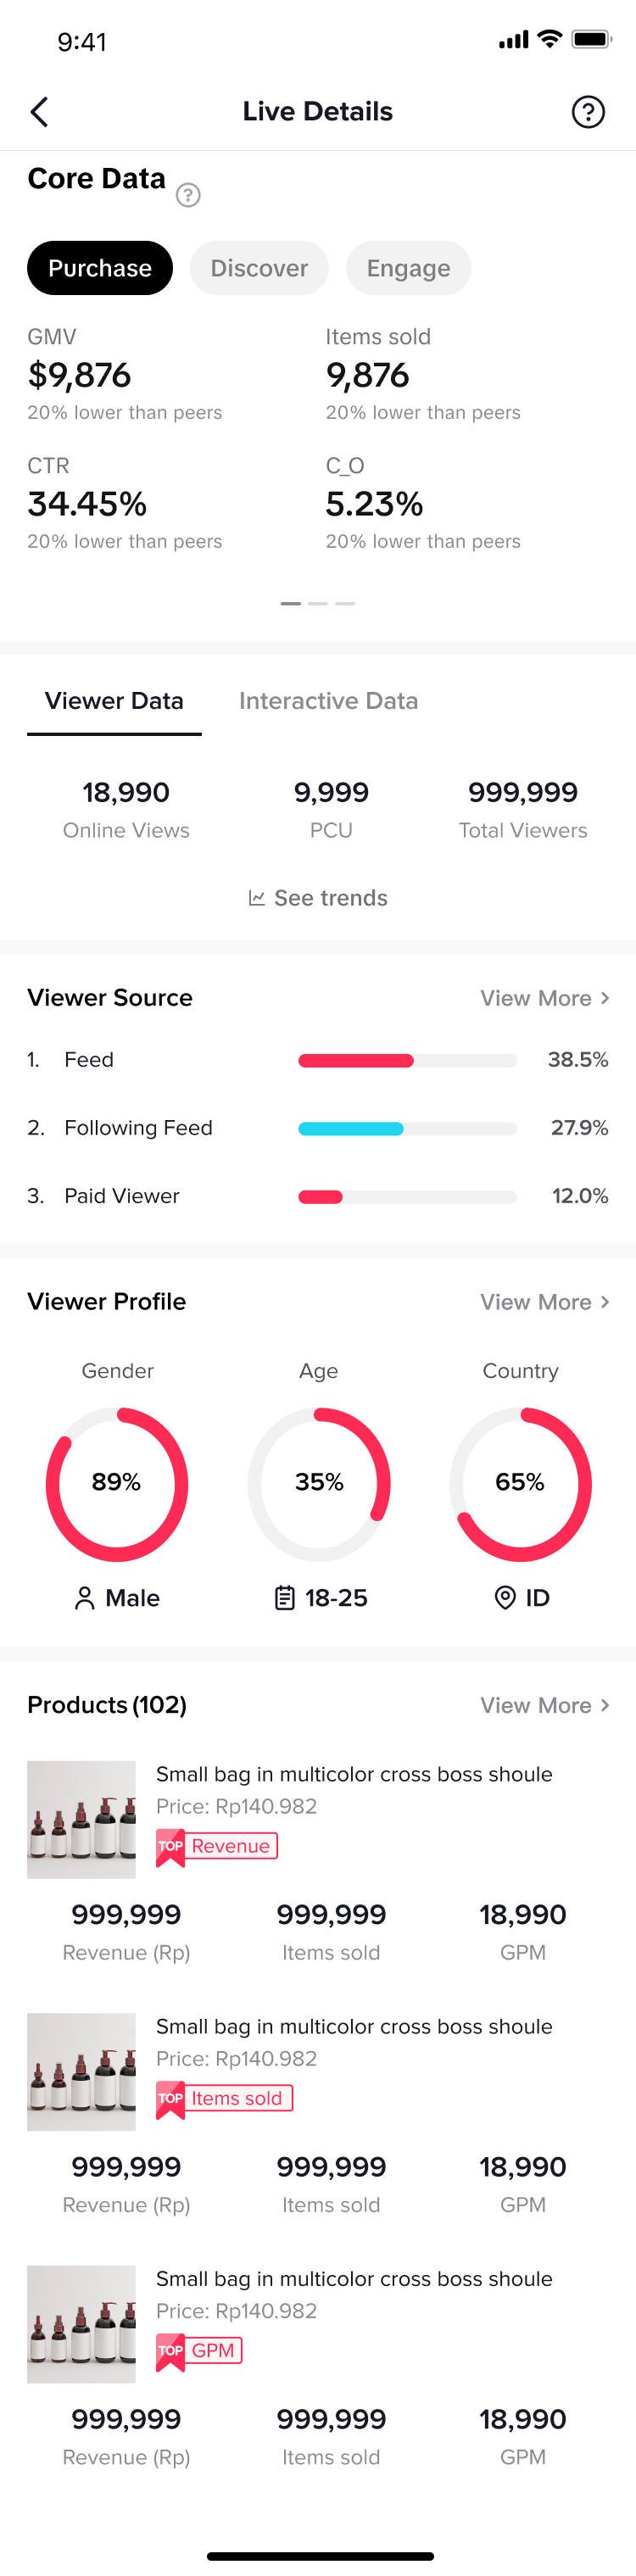 LIVE Details Page |
LIVE Details pageThe LIVE Details page breaks down various insights from an individual livestream performance to give you a well-rounded view of how your livestream performed, where your audience is from, what products were driving revenue, and more.These are the modules available on LIVE Details page:
|  | |
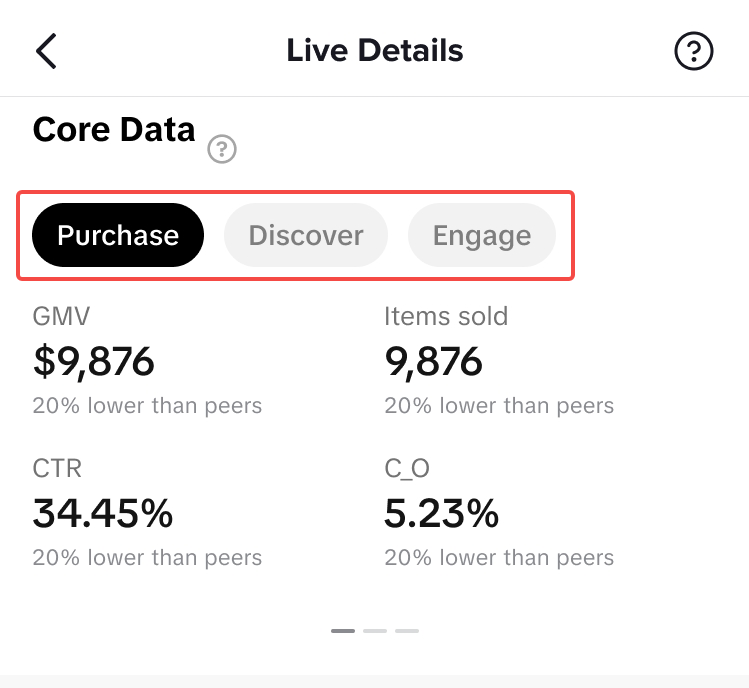
Live Details > Core Data
|  | |
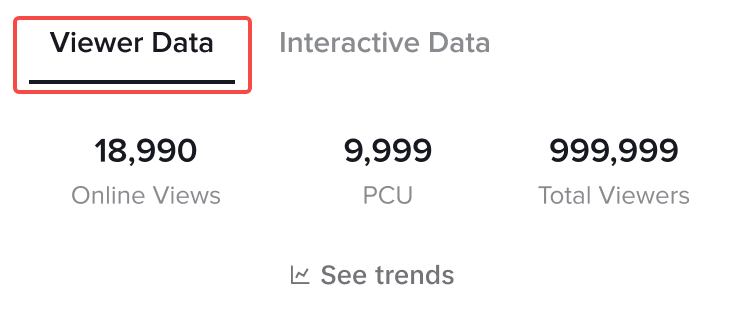
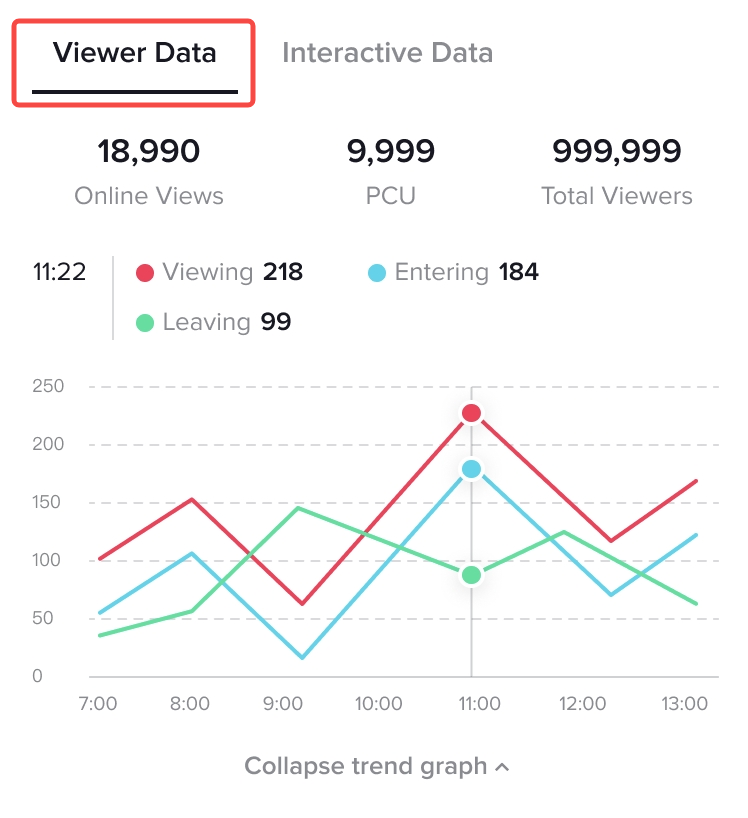
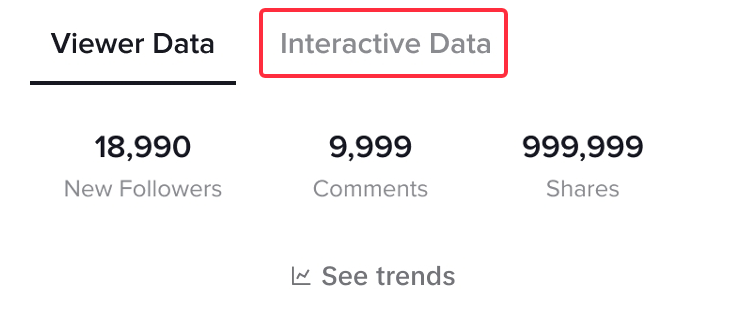
Live Details > Viewer Data
|  |  |
Live Details > Interactive Data
|  | 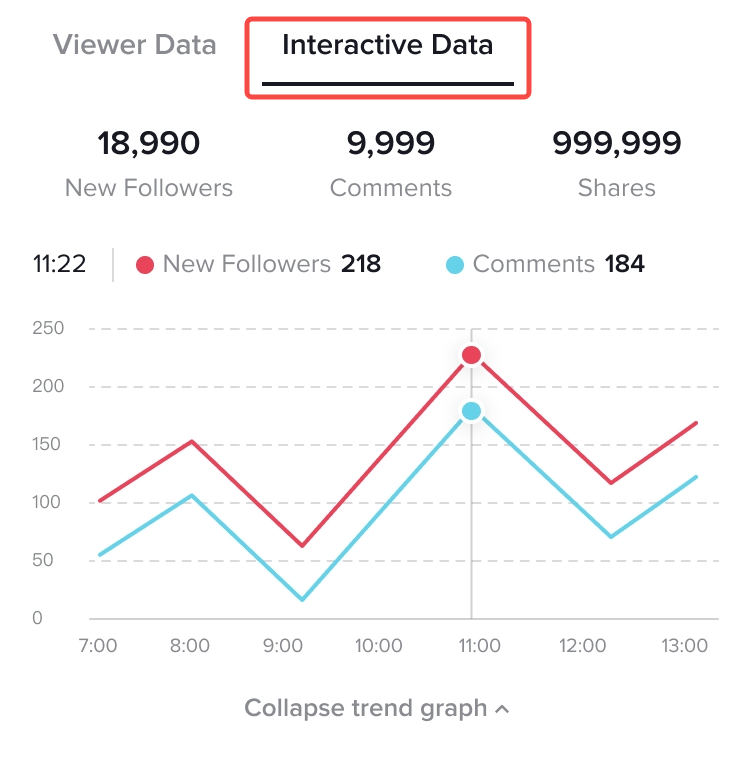 |
Live Details > Viewer Source
| 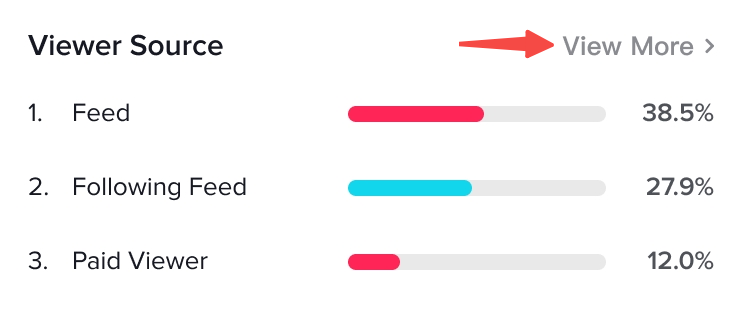 | 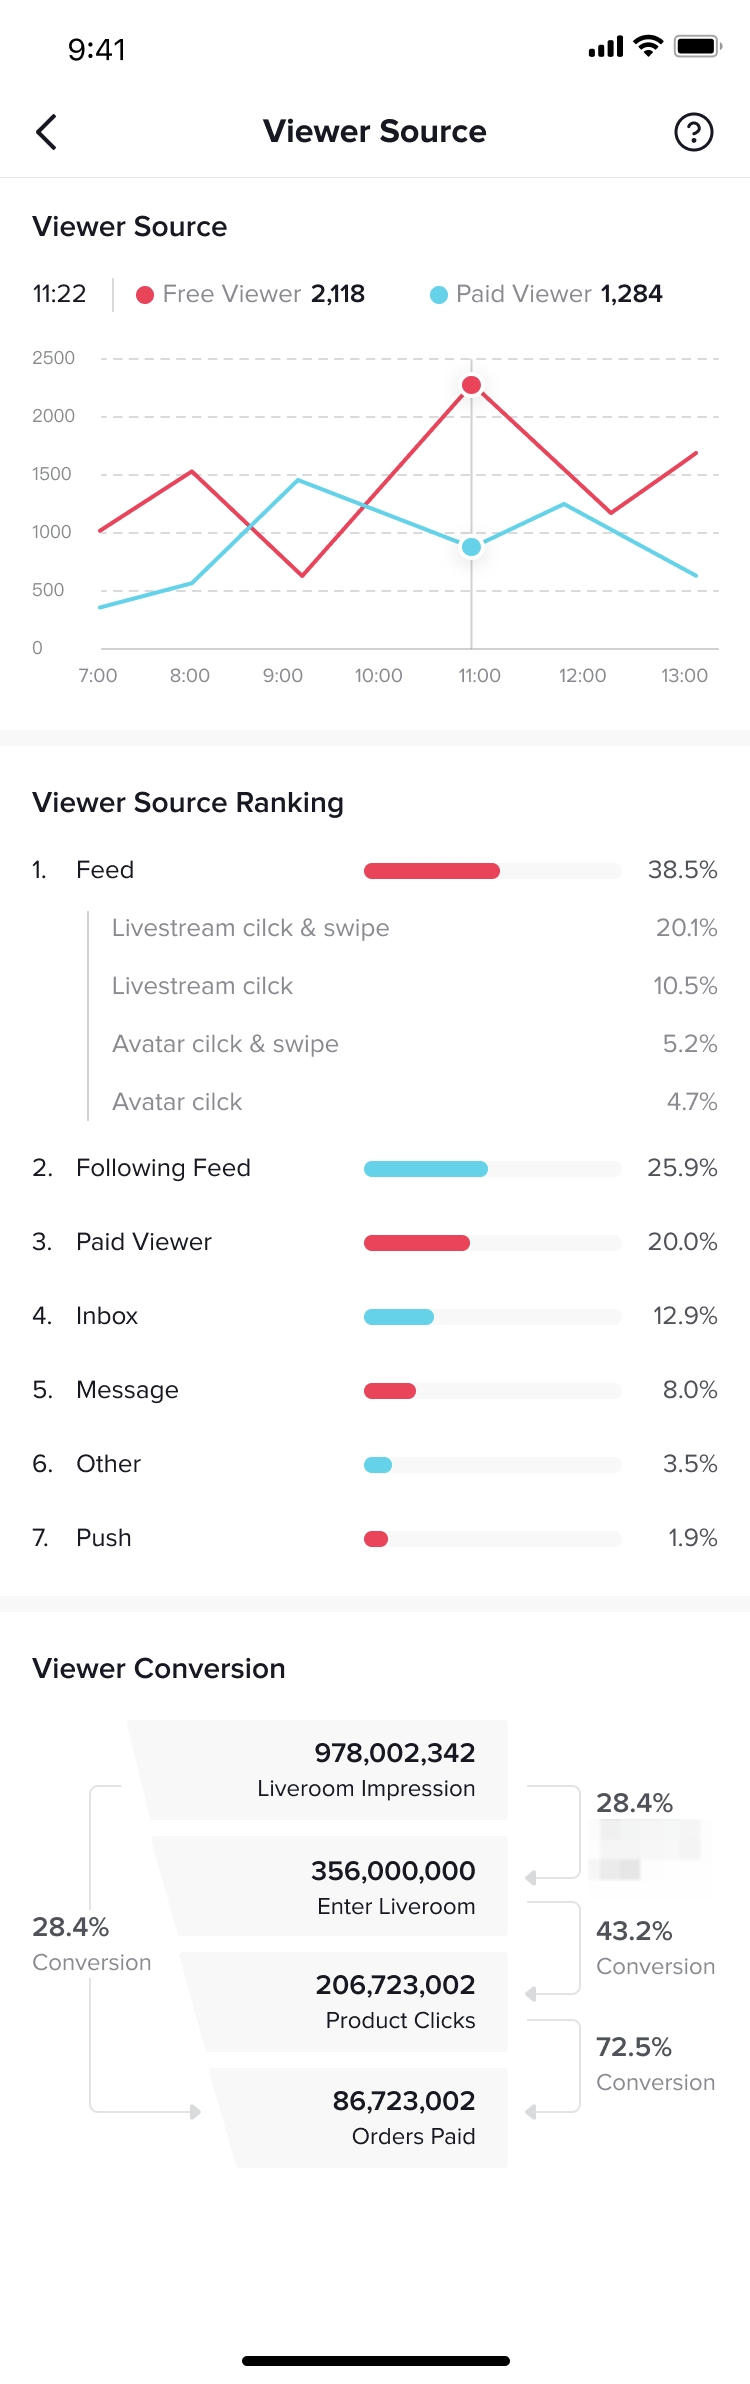 Viewer Source full page |
Live Details > Viewer Profile
| 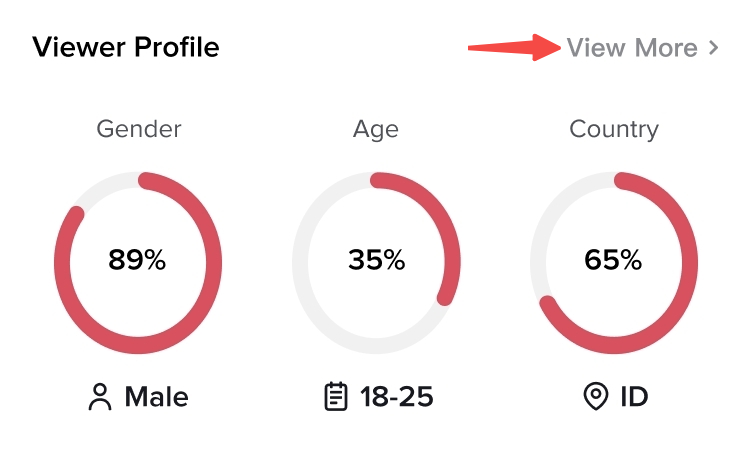 | 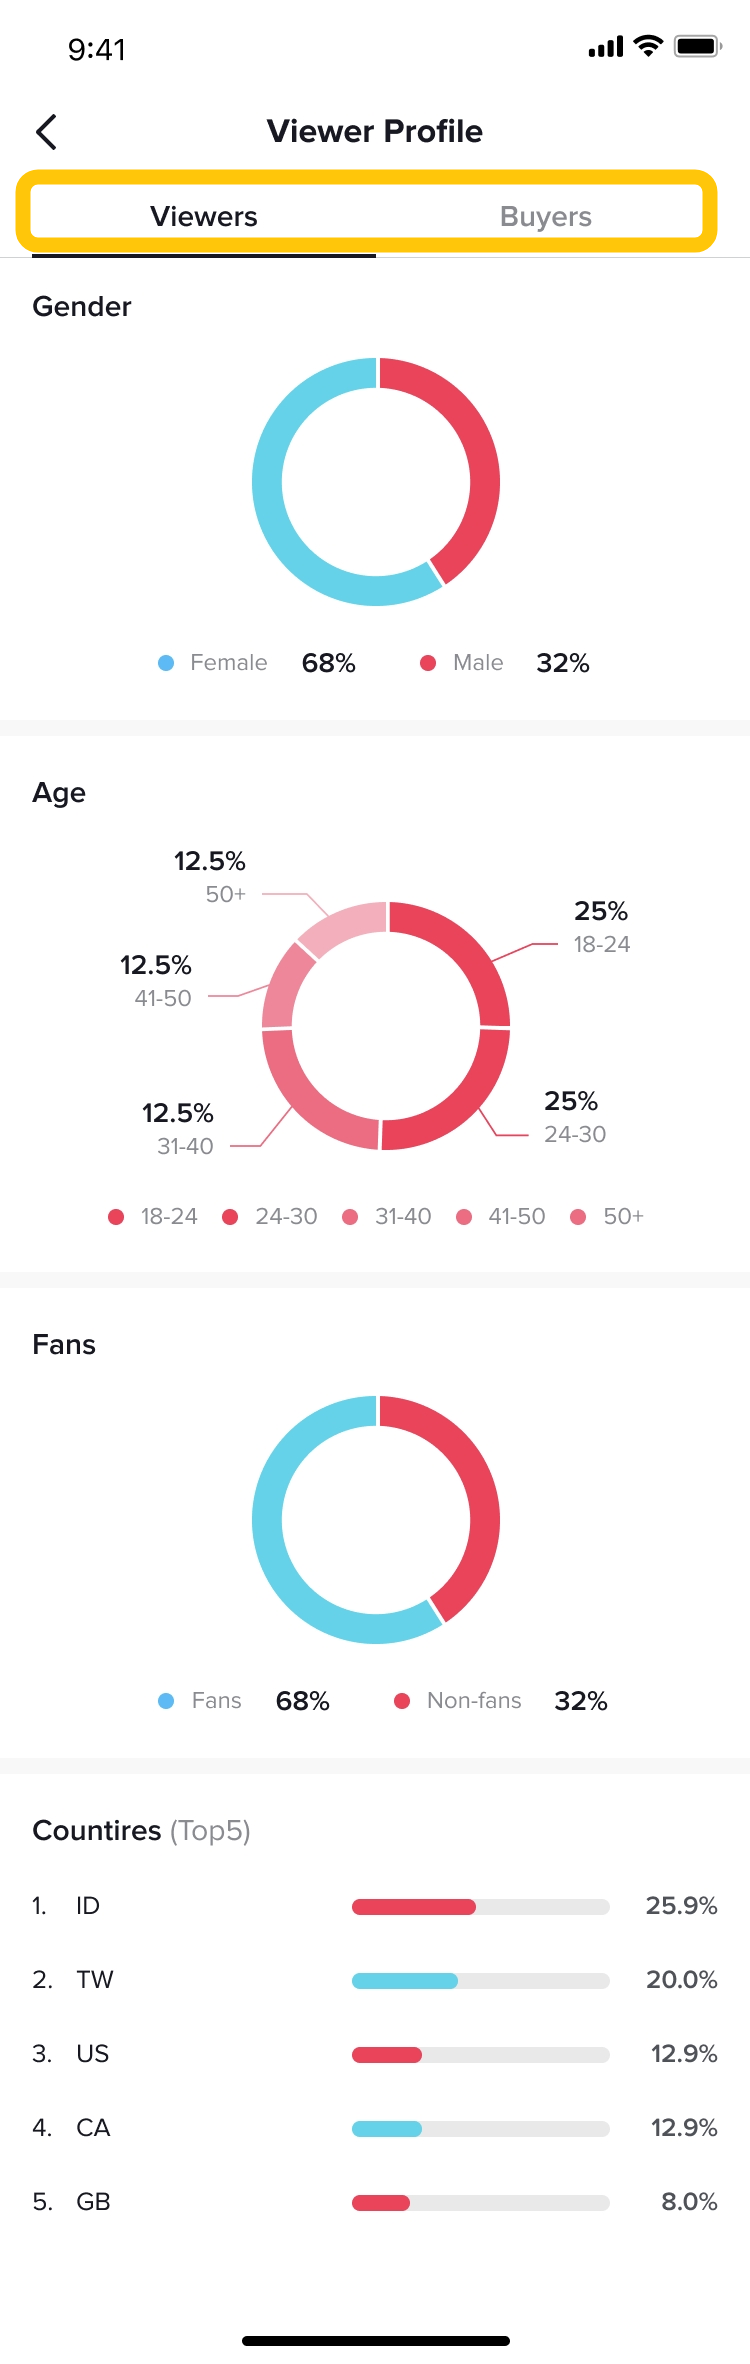 Viewer Profile full page |
Live Details > Products
| 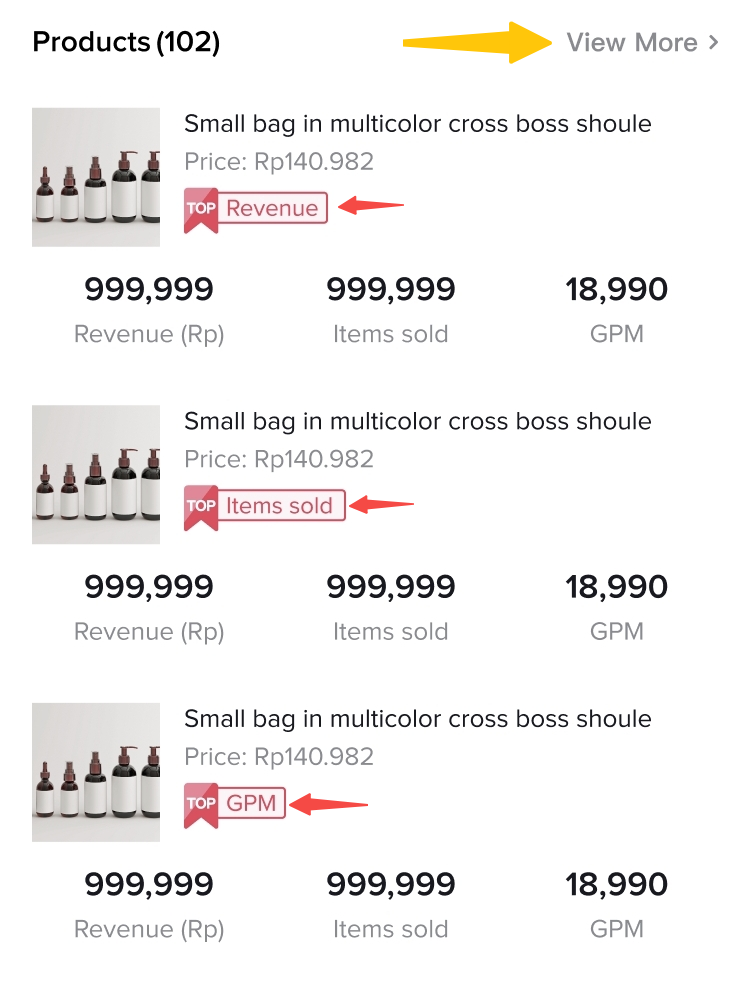 | 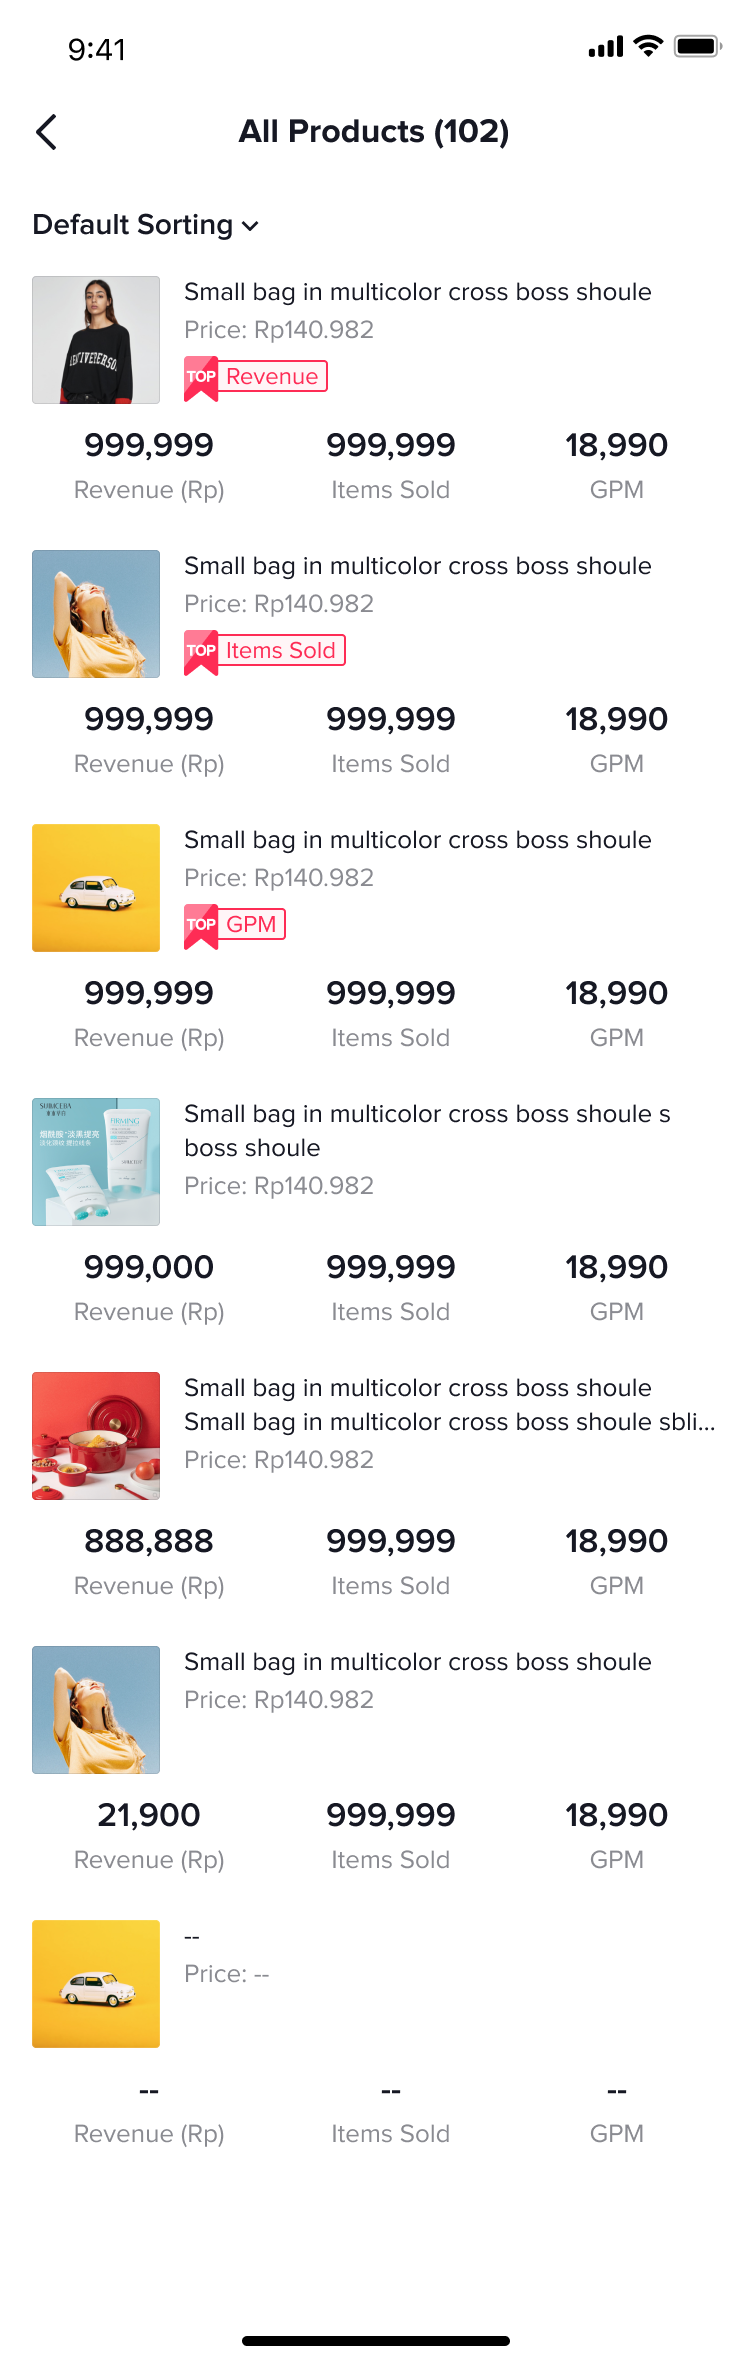 Products full page |
FAQs
- What is the difference between Direct GMV and Attributed GMV?
| Direct GMV | Attributed GMV |
| The total amount paid for orders placed directly from the LIVE, including returns and refunds. | The total amount paid for orders attributed to affiliate content, including returns and refunds. |
| Direct GMV is an indicator of how effective a livestream is in directly driving conversions and sales, and therefore is a more accurate reference when conducting live analysis and diagnosis compared to Attributed GMV. | Attributed GMV allows you to track the GMV performance of the product you promoted due to your affiliate content. This is what is used to calculate your commission. |
Anda mungkin juga tertarik

LIVE Performance
Attention: Please note that the GMV attribution on Seller-related transactions has been changed to C…

LIVE Diagnosis
This article explains LIVE Diagnosis feature overview and how sellers can better prepare for your ne…

LIVE Dashboard
Summary Are you looking for the solution to tracking your LIVE performance comprehensively, during a…