

Analyzing your Livestream data
04/18/2023
Highlights
See a minute by minute performance breakdown of your your Livestreams to understand what droSee the impact pinning products has on your bottom line revenue, and look for fluctuations. Gain insight into the key drivers that led a user to purchase to improve for future livestreaDownload all your product data to analyze New livestream analytics and livestream details pages have been released as partTo see this data, head to Streamer
1. How to use livestream analytics
*🌟 Replay livestreams and look for trendsPlay the livestream back to analyze when transactions happen, th
*🌟 Analyze the conversion funnel and traffic of your LivestreamUnderstand how well viewers are conve
*🌟 Download and analyse product dataYou can download impressi
*🌟 Analyse your AudienceCheck the compos
2. Key features
Detailed introduction | Interface (test account with virtual data, may differ from actual feature) |
| The LIVE summary provides an overview of the transaction, traffic, product, and engagement data for all livestreams hosted by the creator over a period of time. It also displays the livestreams held today and a list of historical livestreams. Livestreams that are currently ongoing can be viewed on the LIVE screen/dashboard and livestream details pages are available for livestreams that have ended. | 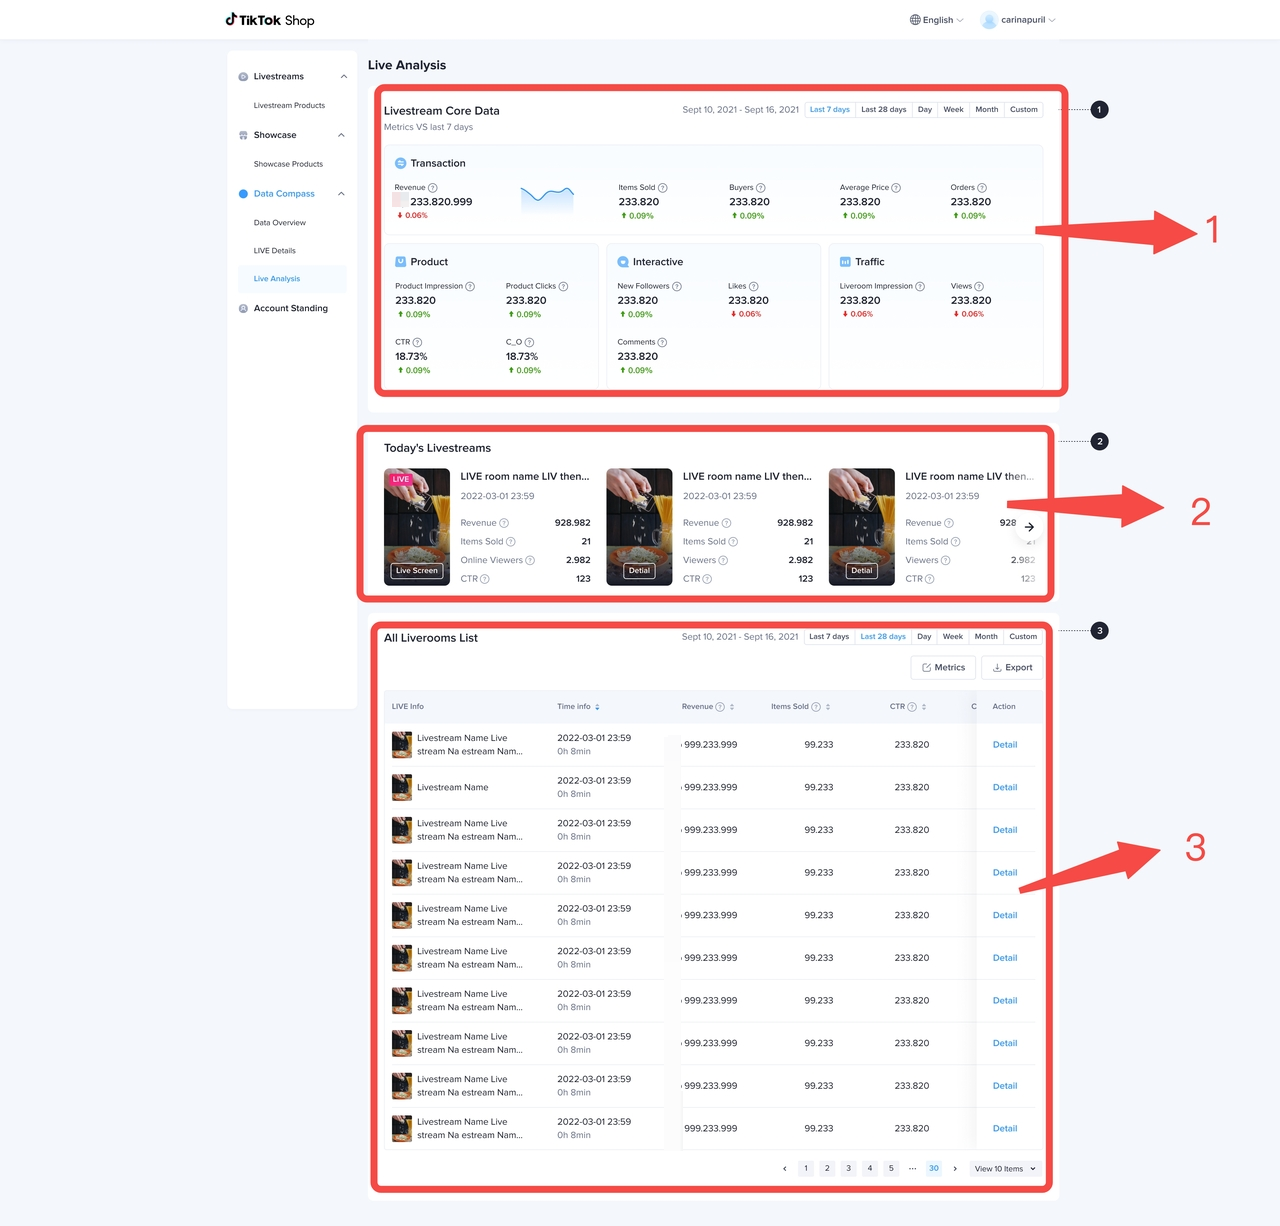 |
Key dataOnce you click "details" to see more in-depth analysis of your Livestream, you'll see key data. Here you can quickly get an overview of key metrics that specific Livestream you are analyzing. | 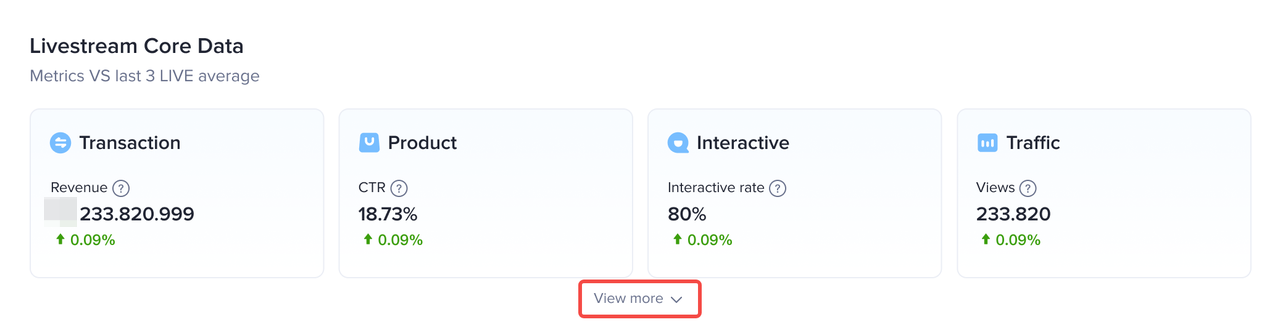 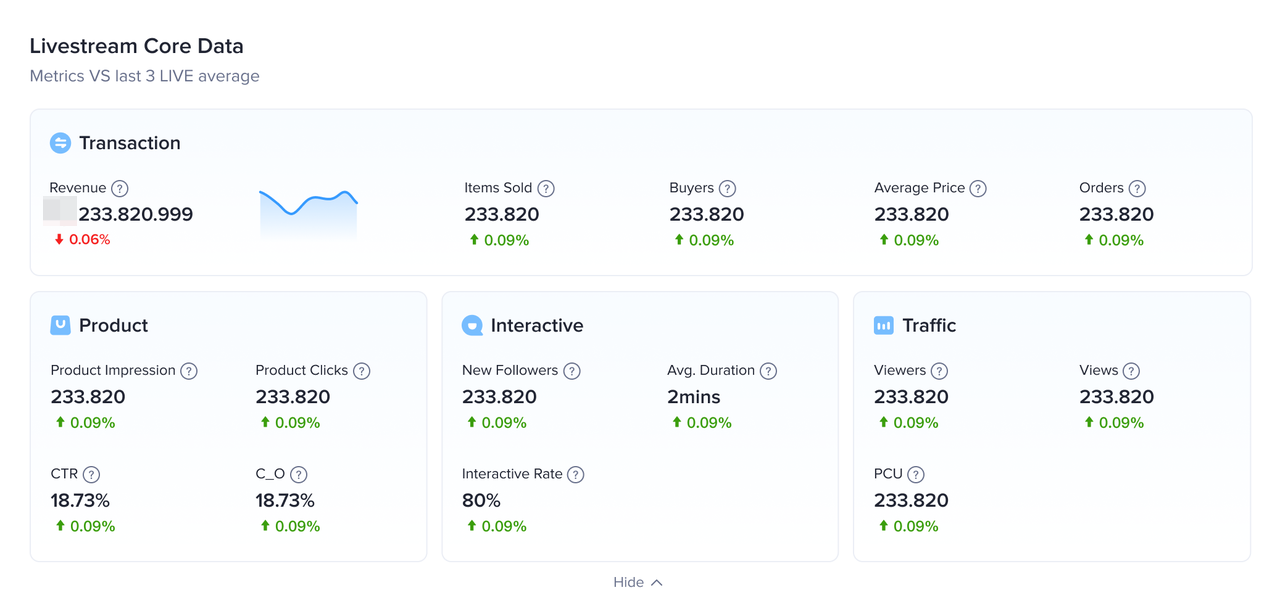 |
Detailed introduction | Interface (test account with virtual data, may differ from actual feature) |
| The content tab shows the relationship between the content of the livestream and audience behavior. This page shows trends when certain products are pinned and discounts or flash sales were provided. It allows you to understand the relationship between the livestream content and transaction, traffic, and audience engagement trends. | 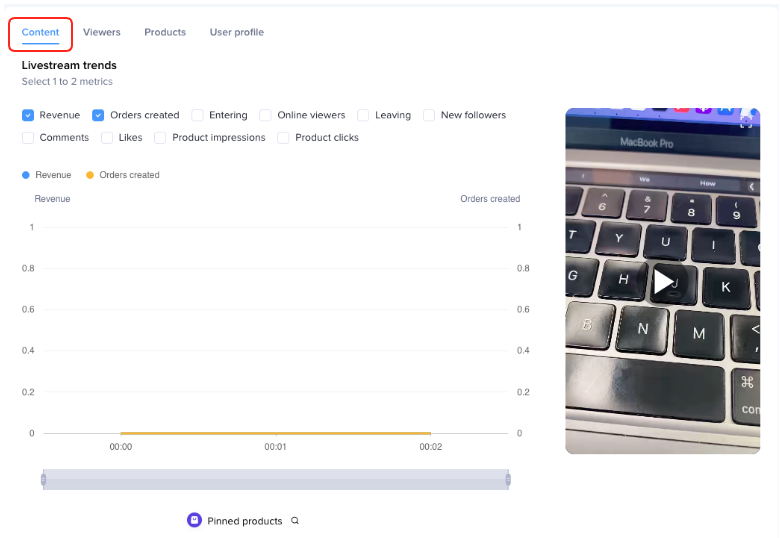 |
Livestream content and data trends
| 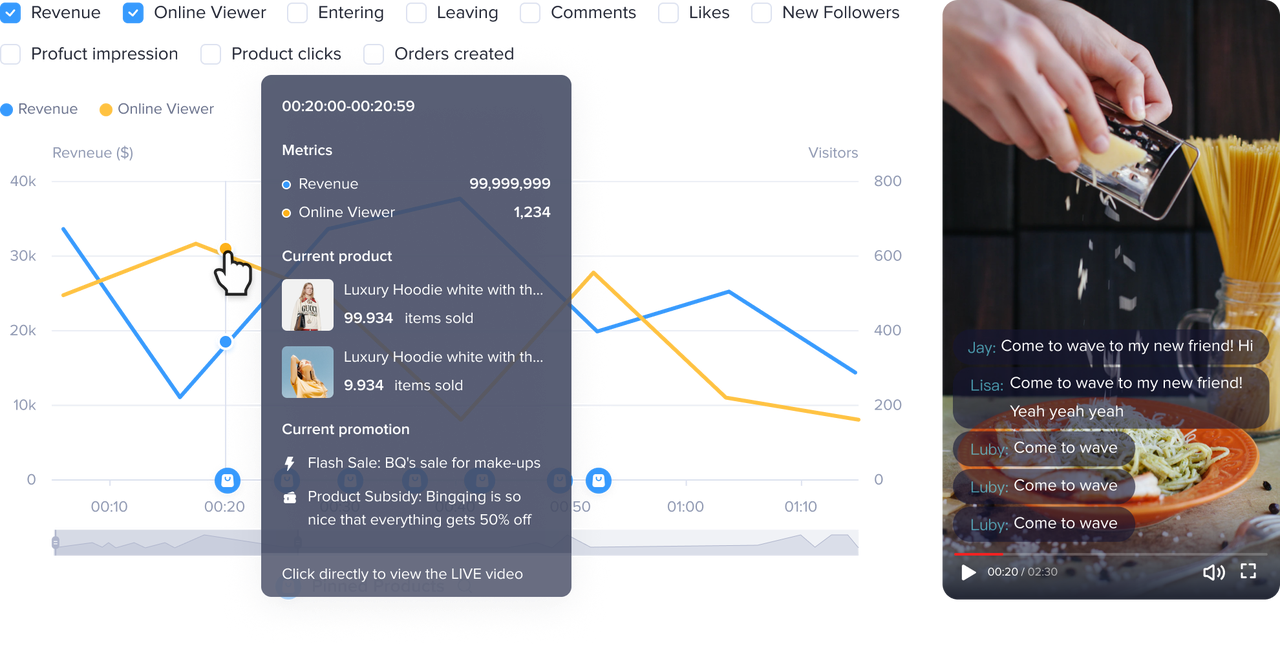 |
Detailed introduction | Interface (test account with virtual data, may differ from actual feature) |
| Understand how well viewers are converted to buyers at each stage of the user journey, from initial livestream impressions, to entering the livestream, having an initial product impression, clicking the product and purchasing. By checking at which stage in the funnel you lose your potential buyers, you can see where you need to improve. You can also see how trends differ for ad traffic (i.e. paid traffic) and organic traffic (free traffic). | 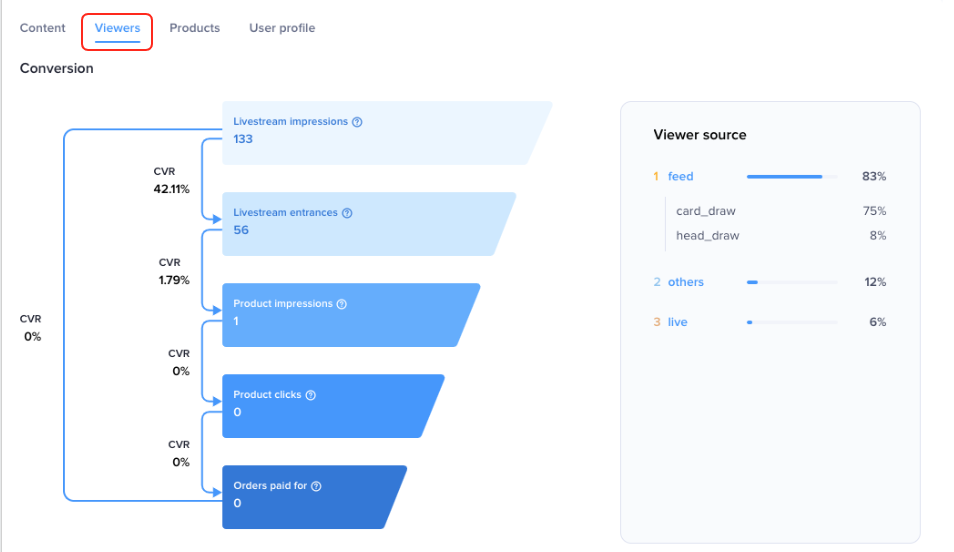 |
Conversion FunnelThe viewers tab shows the user conversion funnel for each stage of the user journey: LIVE impression > entering the livestream > product impression > clicking a product > paying for an order, allowing you to see how well users were converted at each stage.Livestream traffic funnel and traffic sources
| 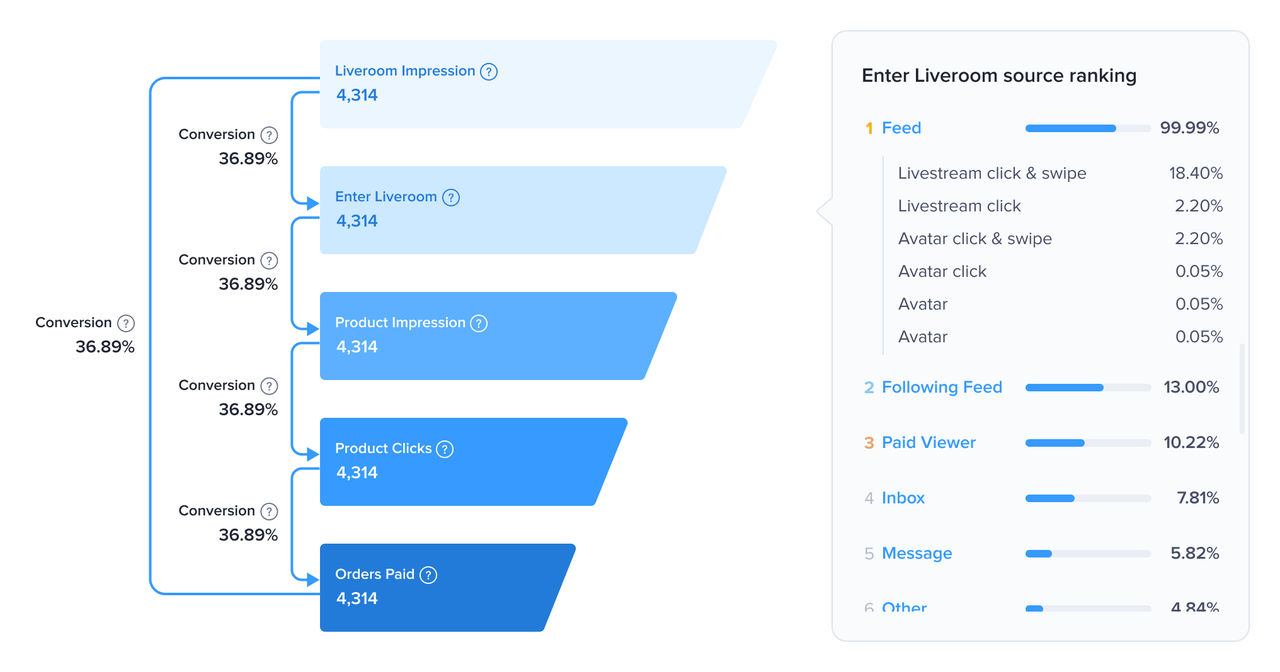 |
Organic traffic and paid traffic trends
| 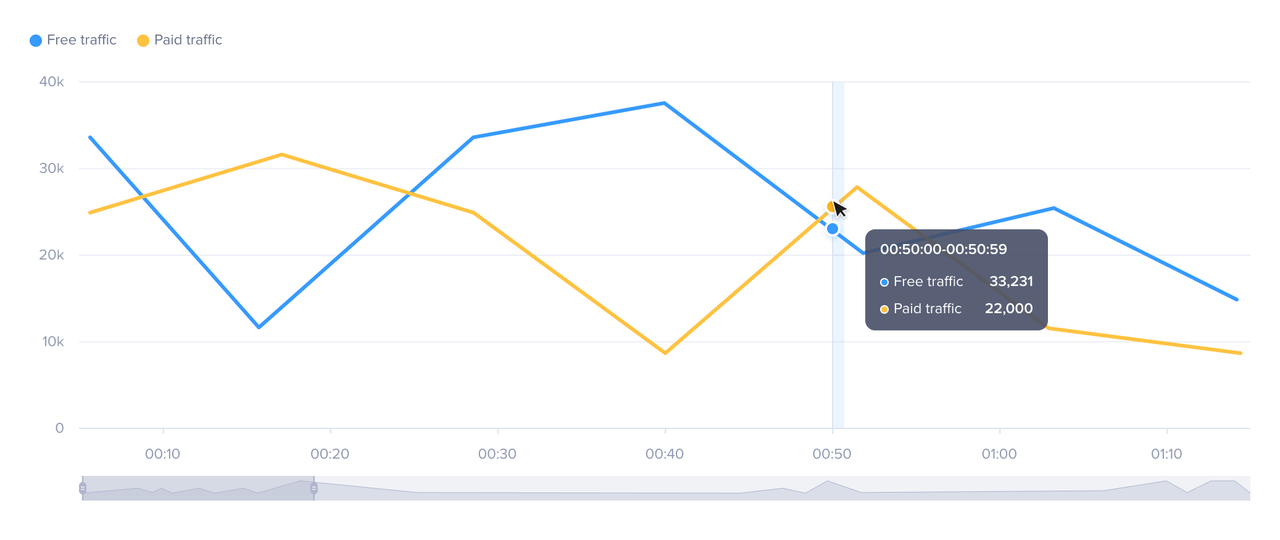 |
Detailed introduction | Interface (test account with virtual data, may differ from actual feature) |
| The products tab displays the products, the number of items sold and ranking of products sold in 1/5/15-minute intervals. Impression, click, transaction and conversion data for all products in the livestream can be viewed and downloaded. | 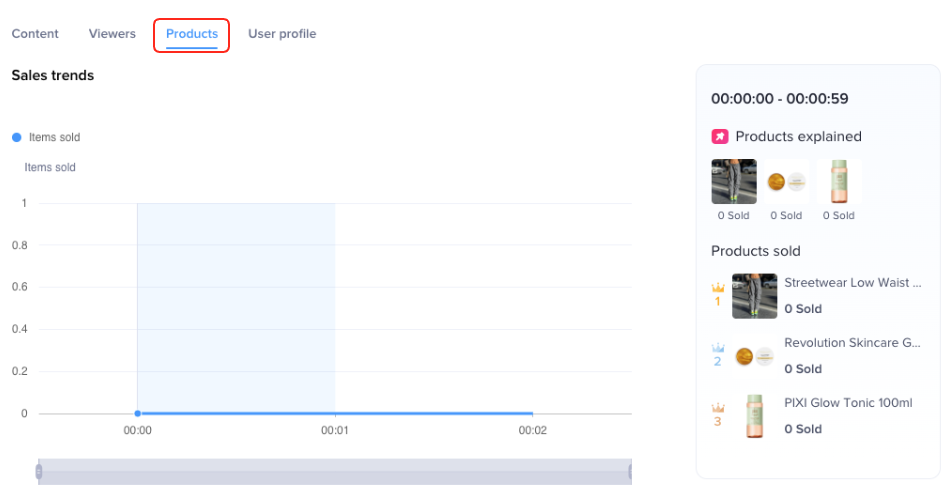 |
Product trends
| 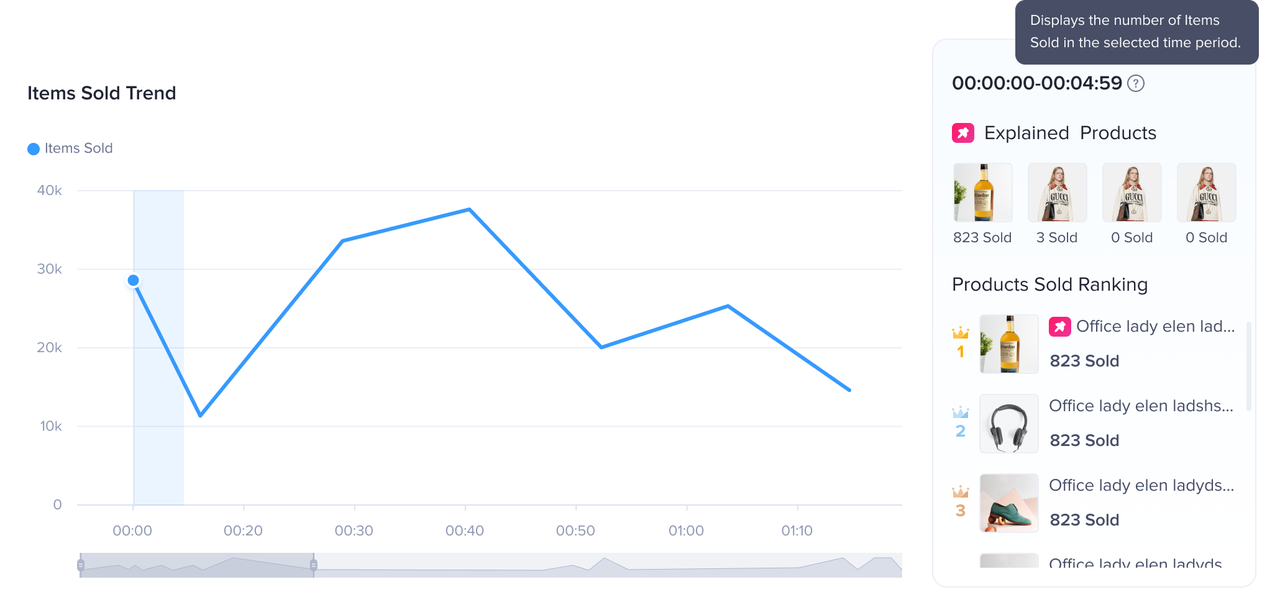 |
Product list
| 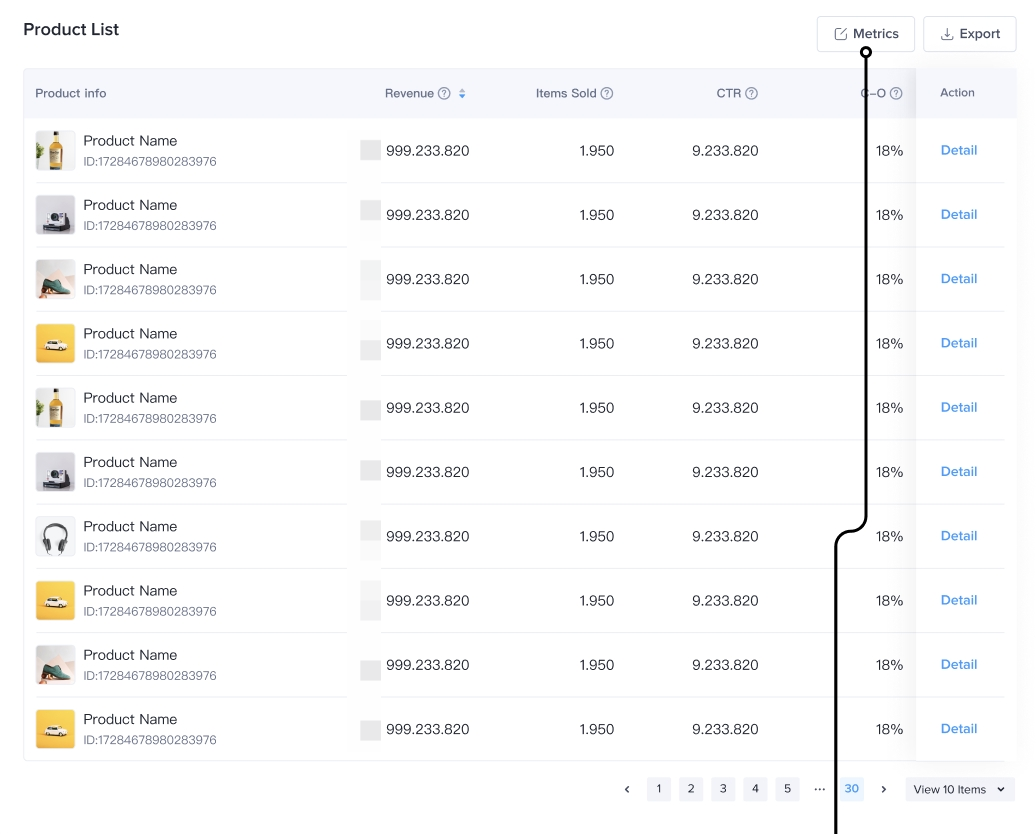  |
Detailed introduction | Interface (test account with virtual data, may differ from actual feature) |
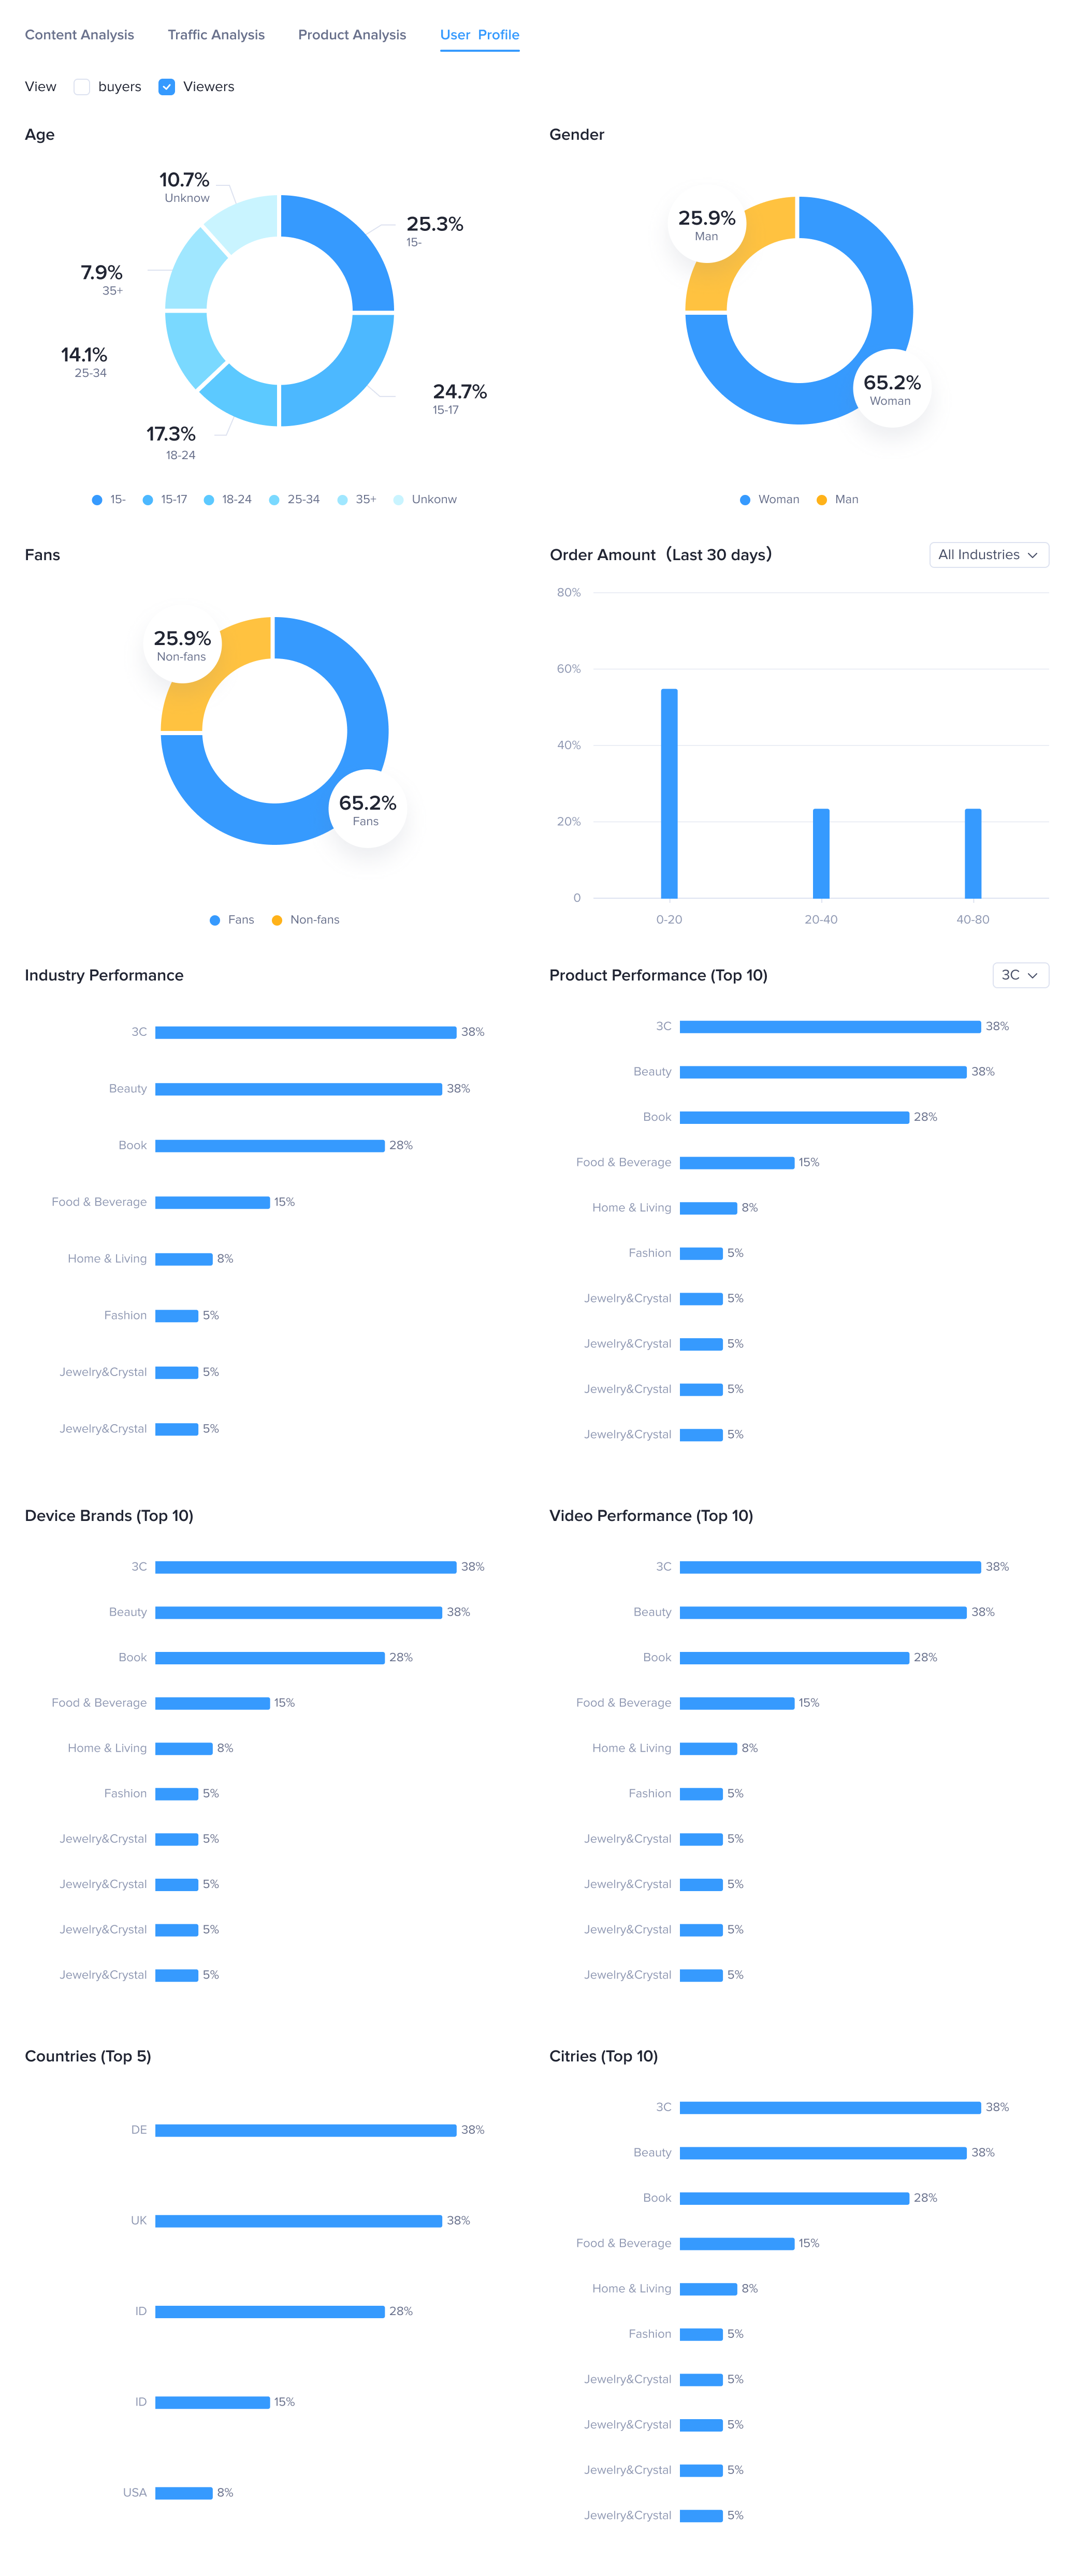
The user profile tab provides information on the demographics of viewers and buyers by age, gender, region and purchasing power.
|  |
- Analyze Audience Insight