1. What ability can data compass provide?
1. Product Feature Overview
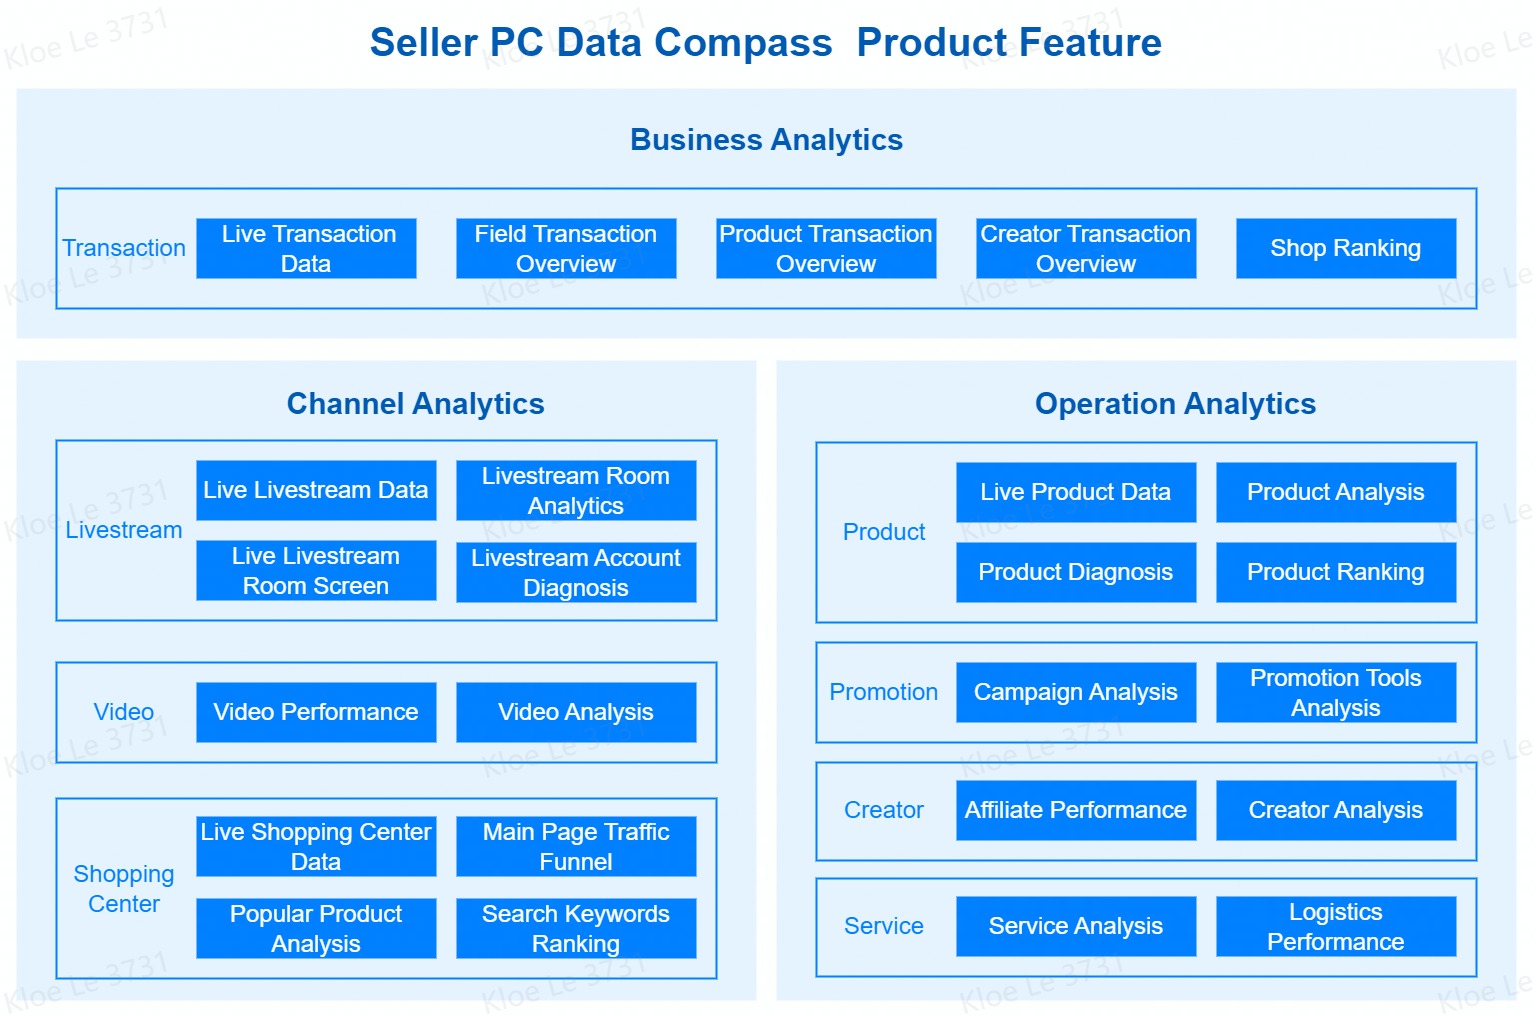
Core Function:
- Shop Revenue Source Channels: Analysing the performance of different channels in terms of sales, breaking down shop transactions to different affiliates, livestreams and videos, and viewing shop sales
- Real-time monitoring of live performance: Real-time monitoring of changes in live traffic sources, mastering the impact factors of live interaction, transactions and orders, and accumulating excellent live strategy
- Review live traffic & revenue: Diagnose the live performance of the account, locate the weak points of traffic, conversion and transaction, and get suggestions for improvements to enhance the live performance
- The outcome of cooperation with the affiliate: Track the performance of affiliates, explore the match between shop products and affiliates, and optimise the affiliate cooperation strategy
- Shop product performance analysis: Diagnose the transaction performance of products in different channels/creators, explore the potential products with high conversion, and help optimise and iterate the product pool
- Track video sales data: Track the performance of videos, dig and learn from outstanding hot videos, and improve the efficiency of video completion, traffic generation and conversion
Examples of Application Scenarios
Scenario 2: Live Operation – live real-time monitoring and recap analysis
Scenario 3: Affiliate Operations-Provide affiliate collaborations recap analysis
2. Details of Data Compass modules
Shop Revenue Analysis
Shop Core Metrics
- Goal: Help sellers quickly understand the real-time revenue and review the historical revenue trend
- Approach:
Method 1: Check today's cumulative revenue and compare it with yesterday's revenue to locate the gap
Method 2: Support to select any time period, view the revenue and refunds, locate the time point of abnormal decline in revenue, and review the direction of shop operations
Method 3: Calculate the net sales of the shop after excluding refunds by using the revenue and refund metrics
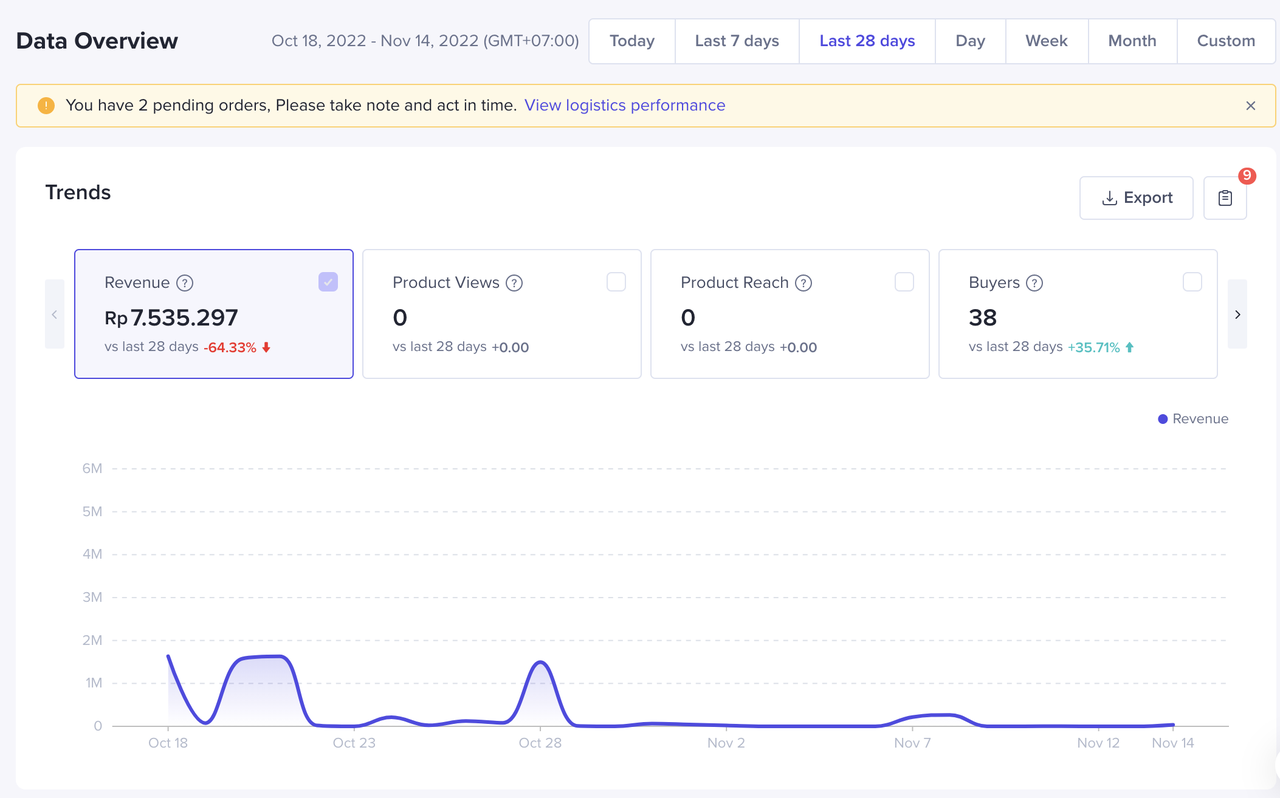
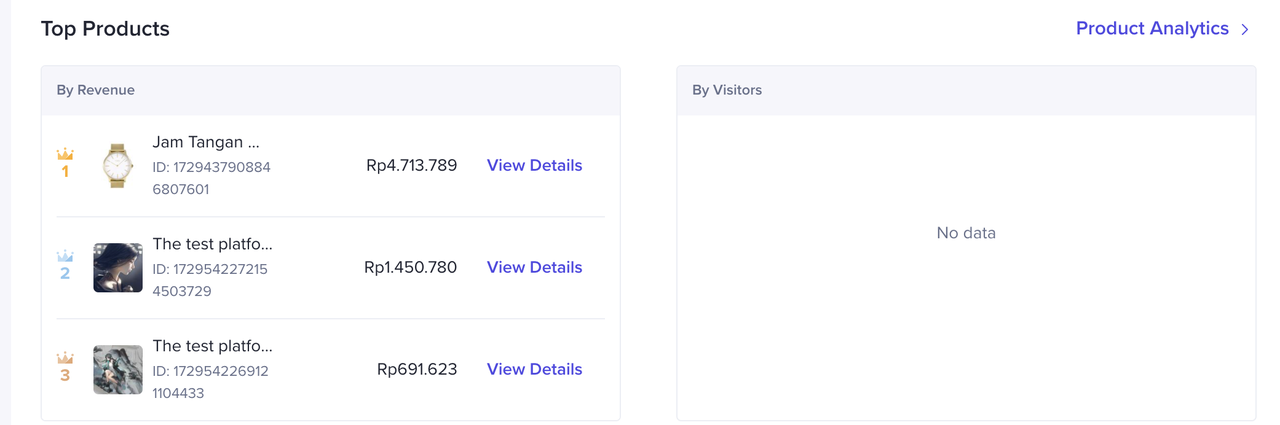
Product Ranking overview
- Goal: View real-time TOP revenue and TOP traffic products to locate recent most popular products
- Approach:
Method 1: Check the TOP revenue products to find out which products users most like to buy, compare the changes of TOP revenue products in different periods, and find out which products have increased in popularity and which ones have decreased in popularity
Method 2: Check products with TOP traffic, find out which products consumers are most interested in, compare the ranking of products with TOP traffic and TOP revenue, dig out products with high traffic but low revenue, and determine whether it is because of factors such as high prices/descriptions of products that prevent users from placing orders
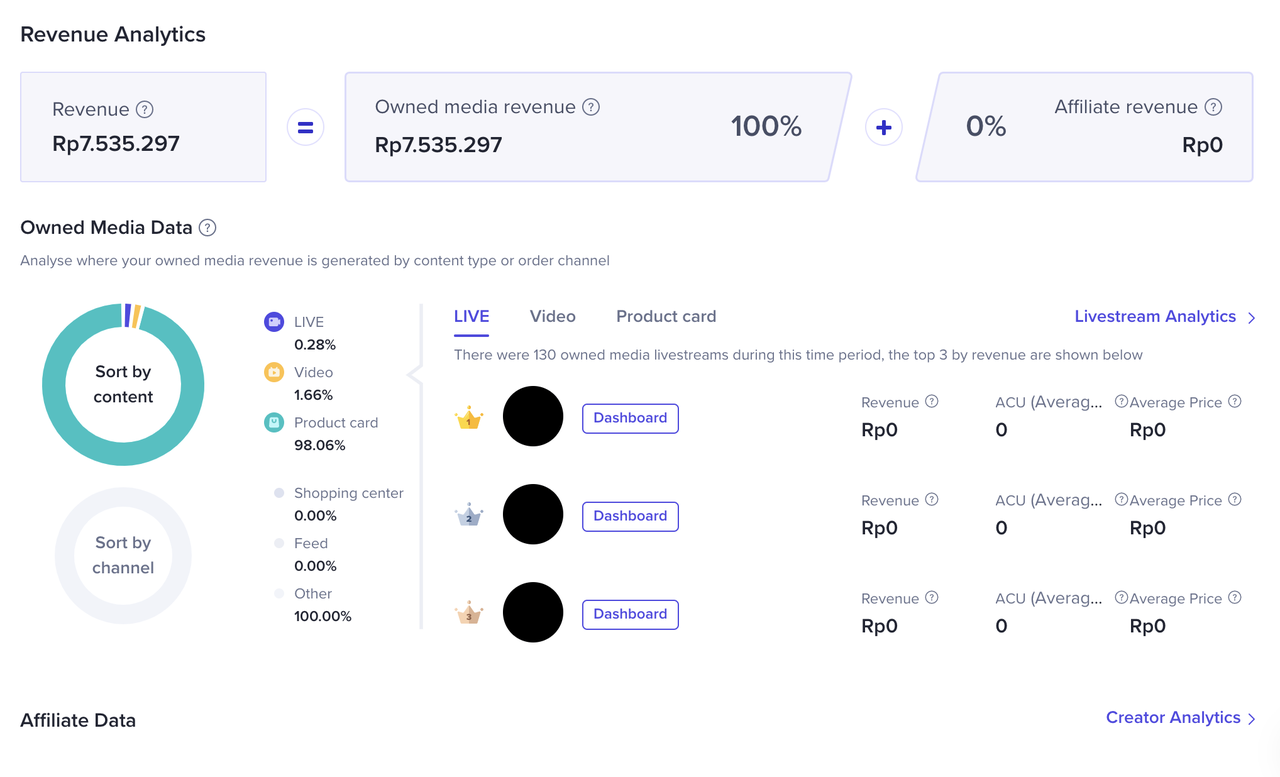
Channel Revenue Split: Self-Operated & Affiliate
- Goal: Split the amount and percentage of revenue from self-owned accounts and affiliate accounts respectively, to locate the highest source of transactions channels
- Approach:
Method 1: Understand the percentage of the shop's recent revenue amount sold by the shop itself and affiliates, and understand the advantages of self-owned/affiliate shops to adjust the shop's subsequent action in self-owned and affiliate strategy
Method 2: Understand the self-revenue of live, video and product card channels, compare the invested energy and money in live/video channels, and adjust the channel investment strategy according to the channel efficiency.
Method 3: Quickly find the livestreams, videos and affiliates who contribute the largest GMV to the shop, find the livestreams and videos with the highest revenue, learn and copy the excellent livestreams and videos, and strengthen the follow-up cooperation with high-sales affiliates
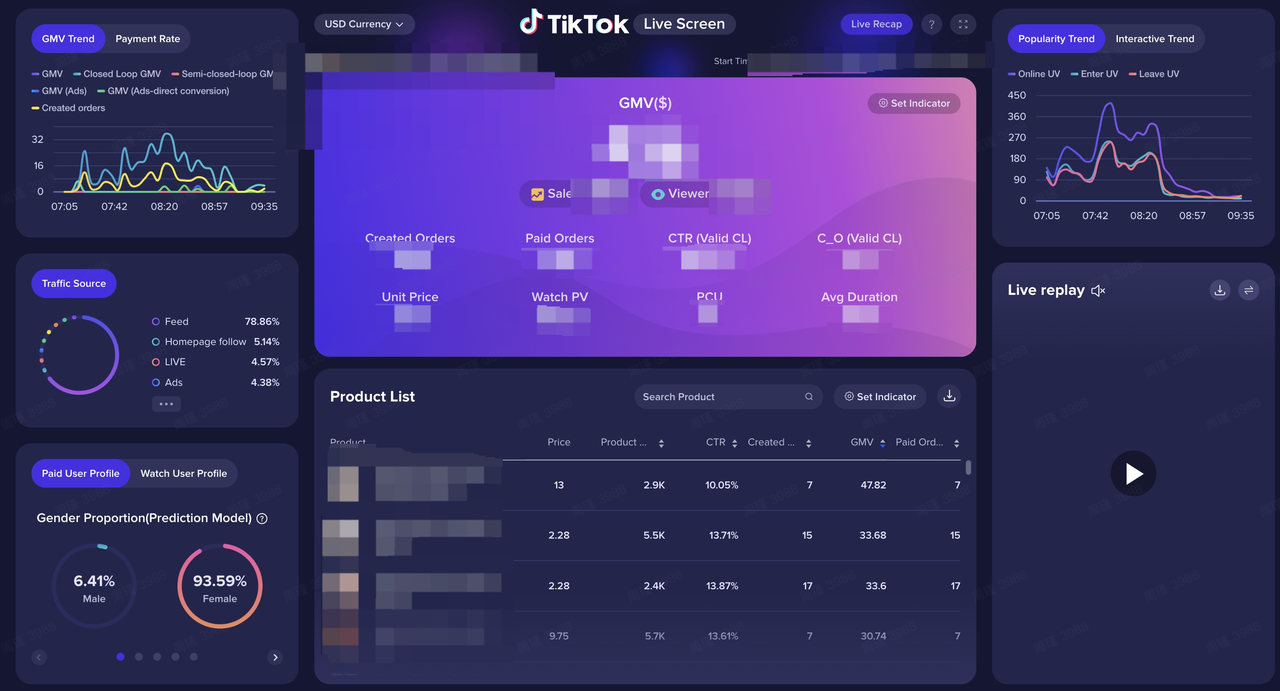
Content Analysis
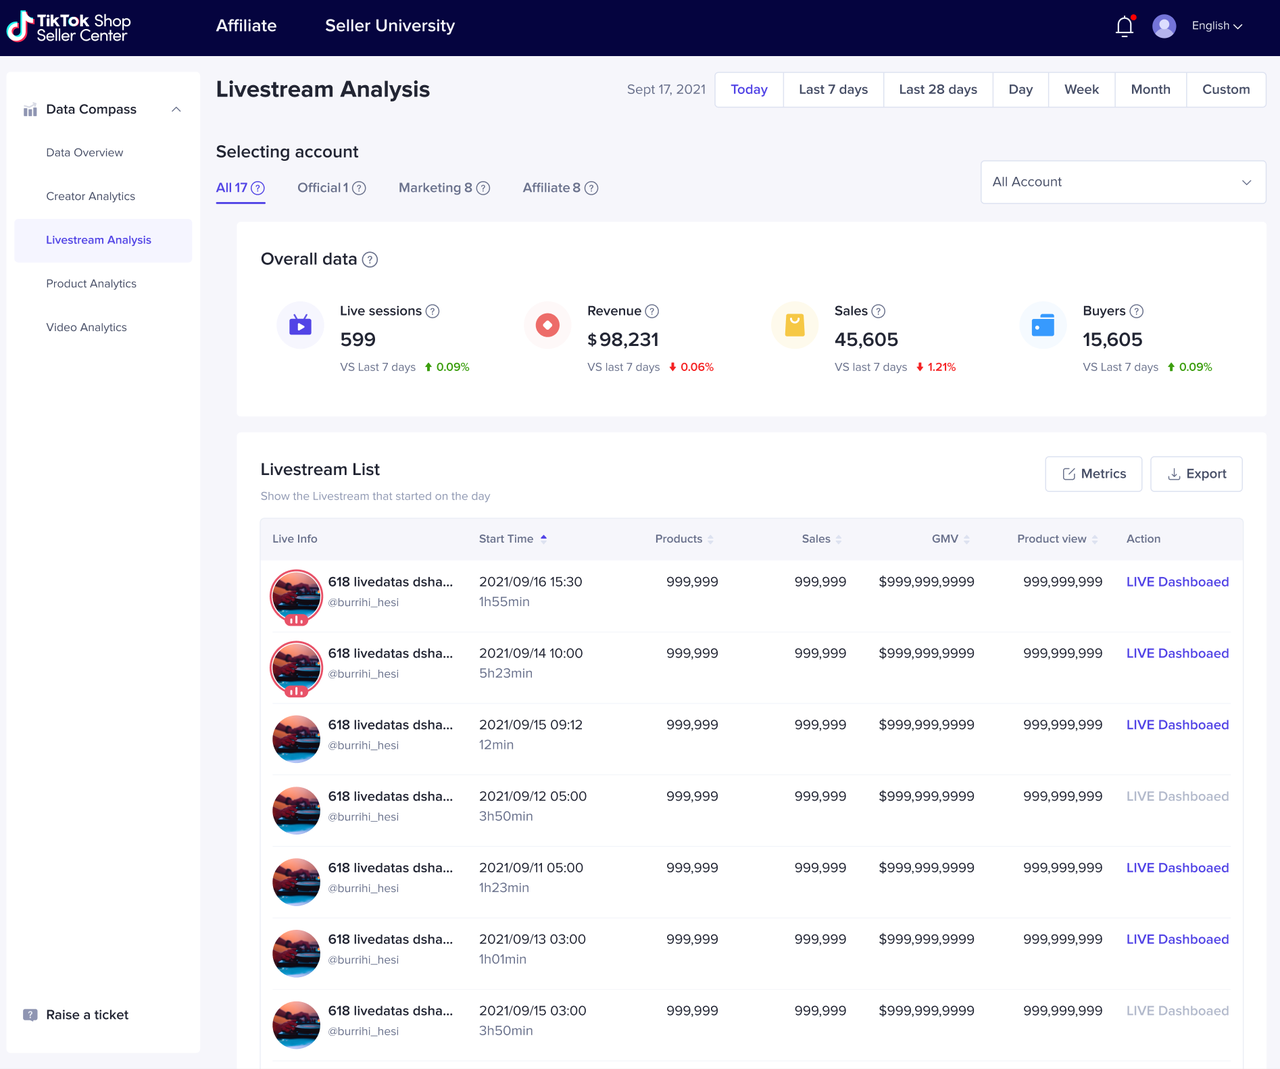
- Goal: Help sellers understand the live data performance of the whole shop and each account in real time, and be able to view the live screen of the livestream of self accounts, perform livestream monitoring and recap livestream performance
- Approach:
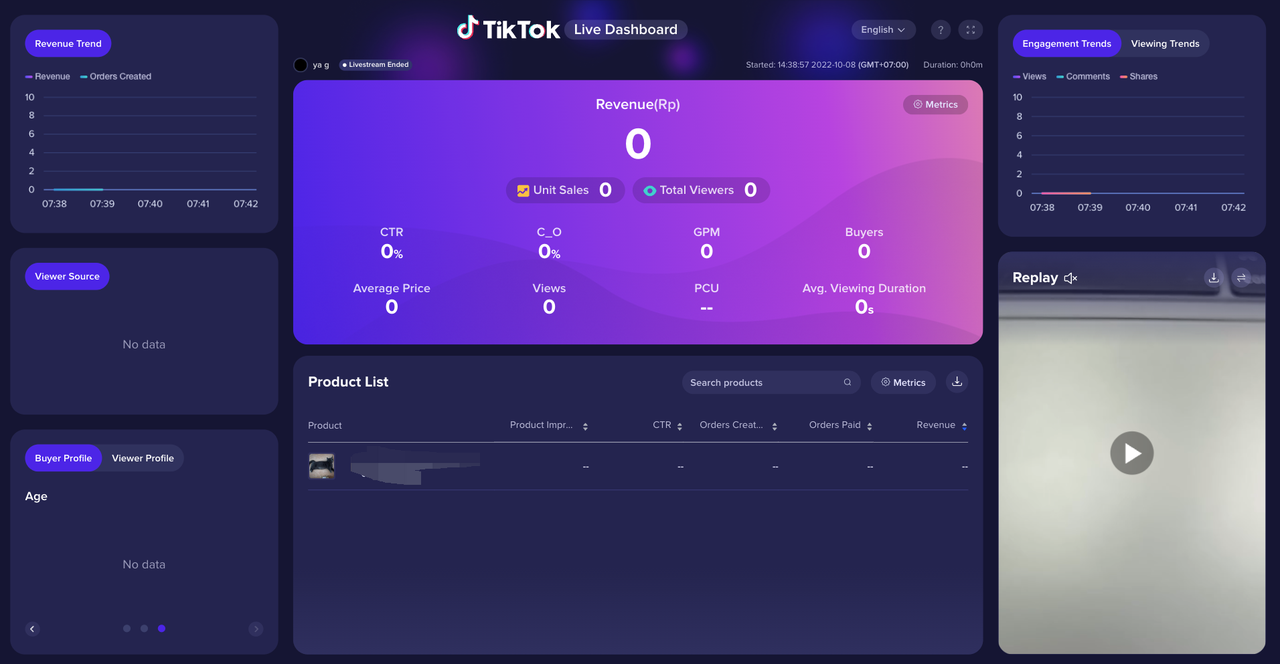
Method 1: View the livestream summary data performance of the whole shop or a single account, you can perform real-time monitoring and analysis of historical data, and you can view the data performance of each ec livestream with the sellers' products
Method 2: For the seller's own account, you can access the live screen of the livestream of each ec livestream, and perform real-time data tracking and data recap after the livestream ends
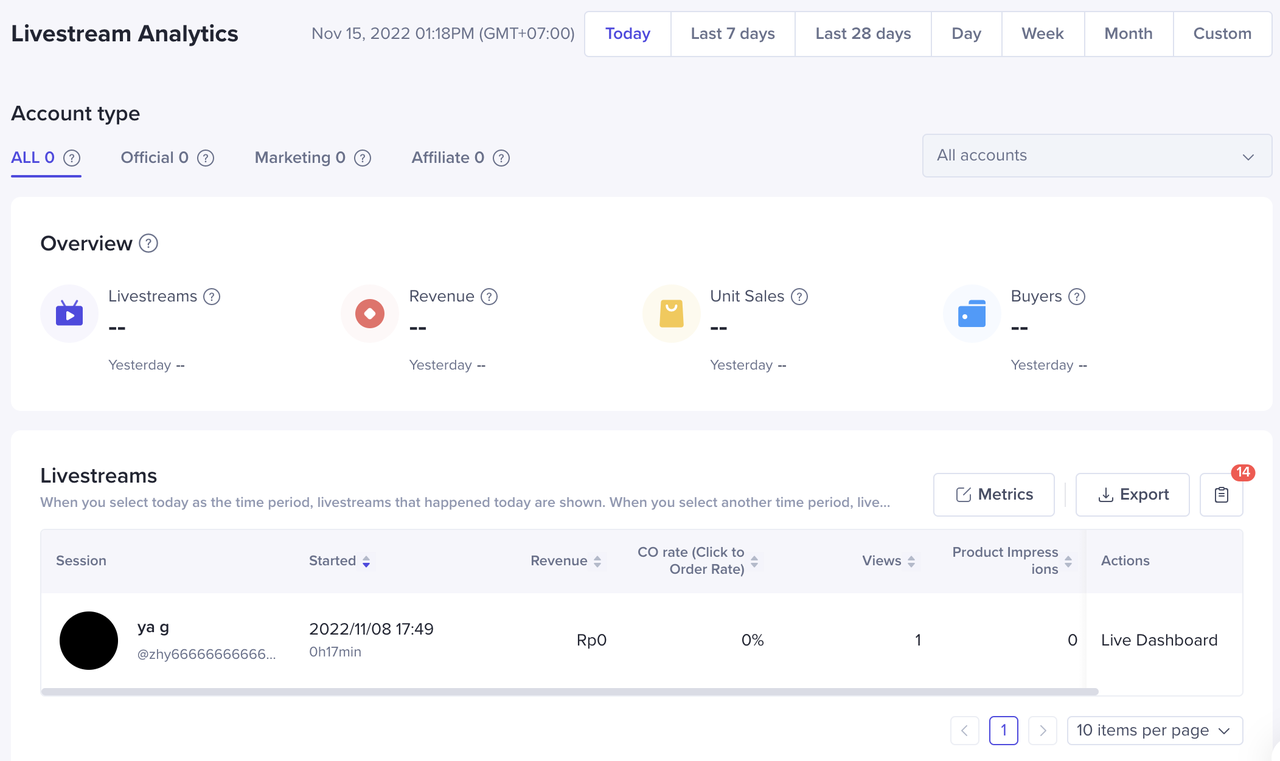
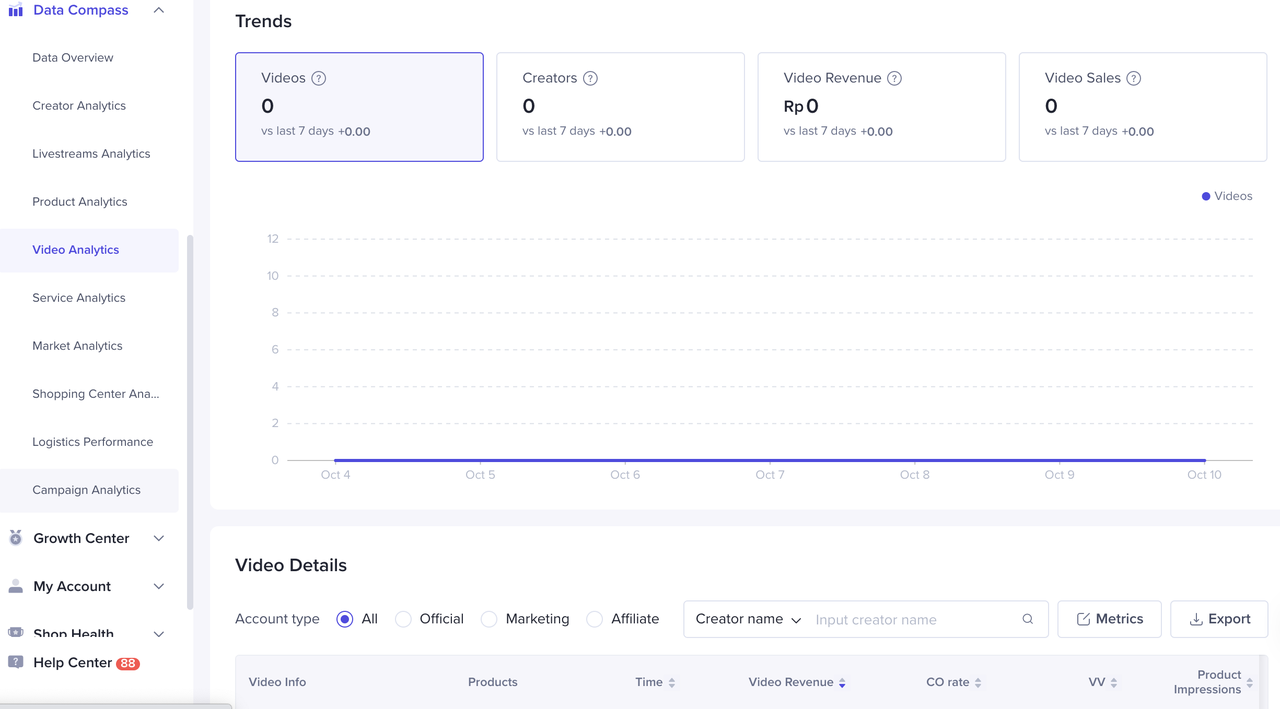
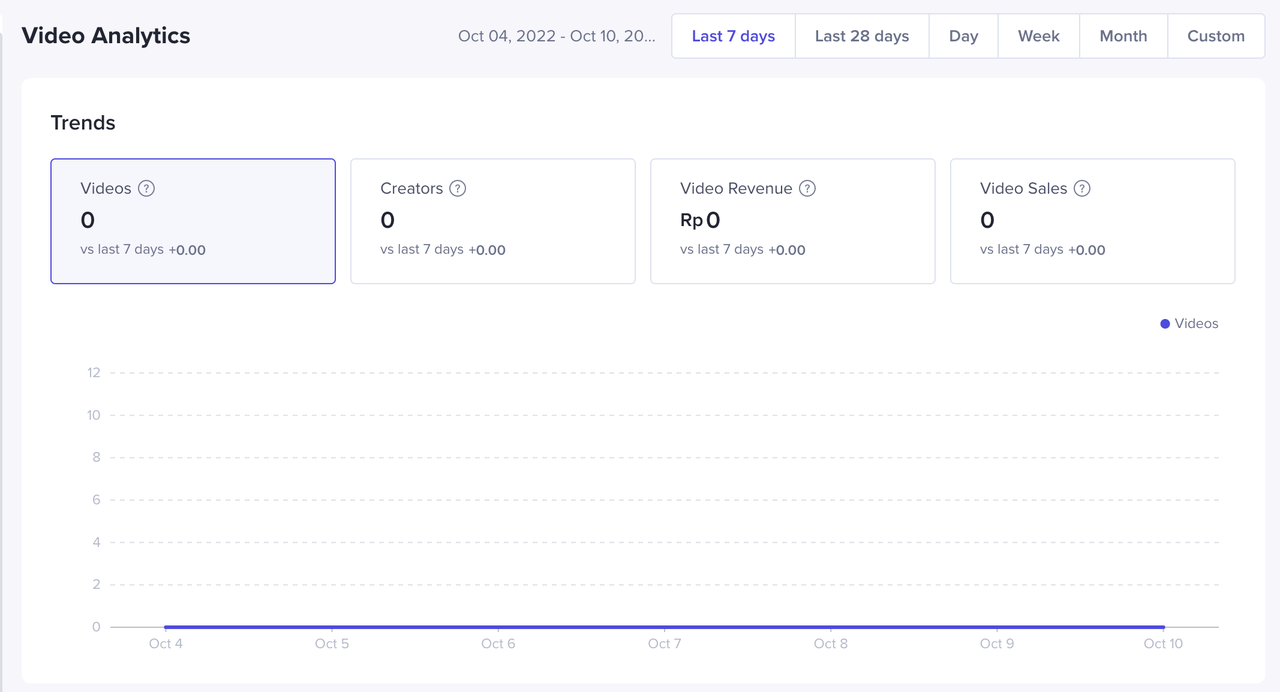
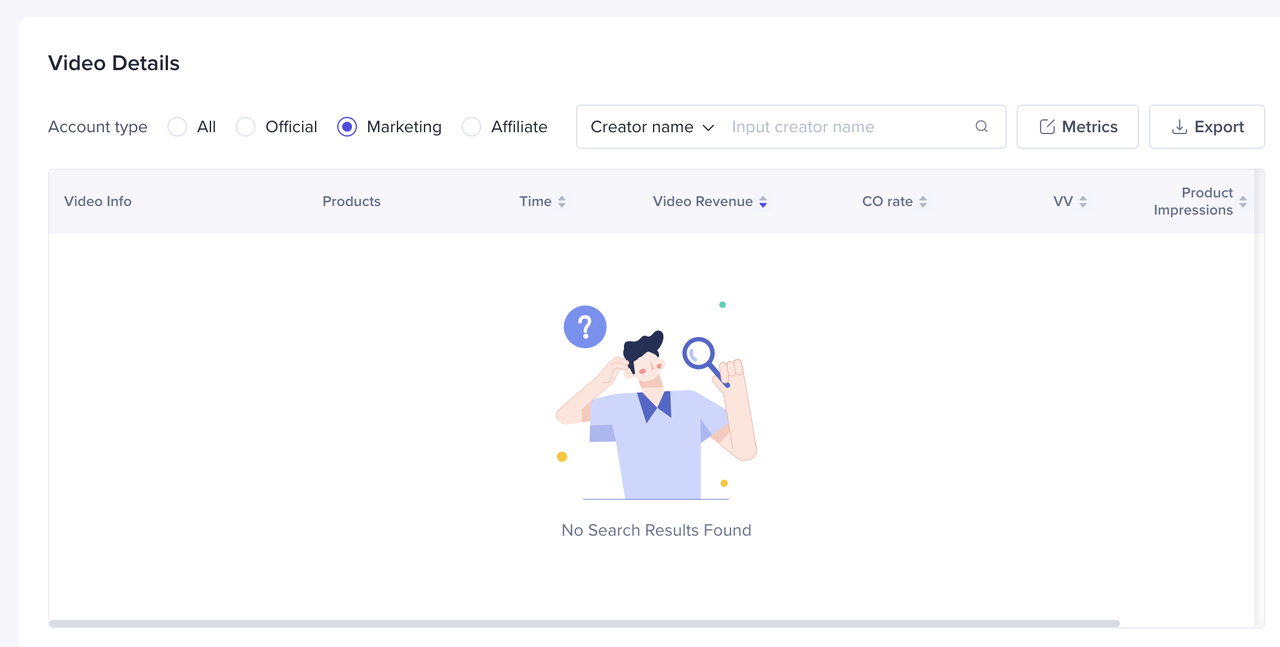
- Goal: Help sellers to see the posting and transaction status of short videos in the selected time period, and review the changes in short video-related transactions and sales trends
- Approach:
Method 1: View the cumulative number of short video posts, the number of posters, short video transactions and short video sales trends for the last 7 days, and locate the intra-week variance
Method 2: Support for selecting the most recent 28 days or by day/week/month/and any time period to view the number of short videos, the number of creators, the performance of transactions and sales, and locate the point in time when short videos and transactions have dropped abnormally
Method 3: According to the type of account (official/marketing/affiliate), view the performance of different videos posted by a particular creator, in terms of checking sales and conversion data, and review the operation direction of short videos
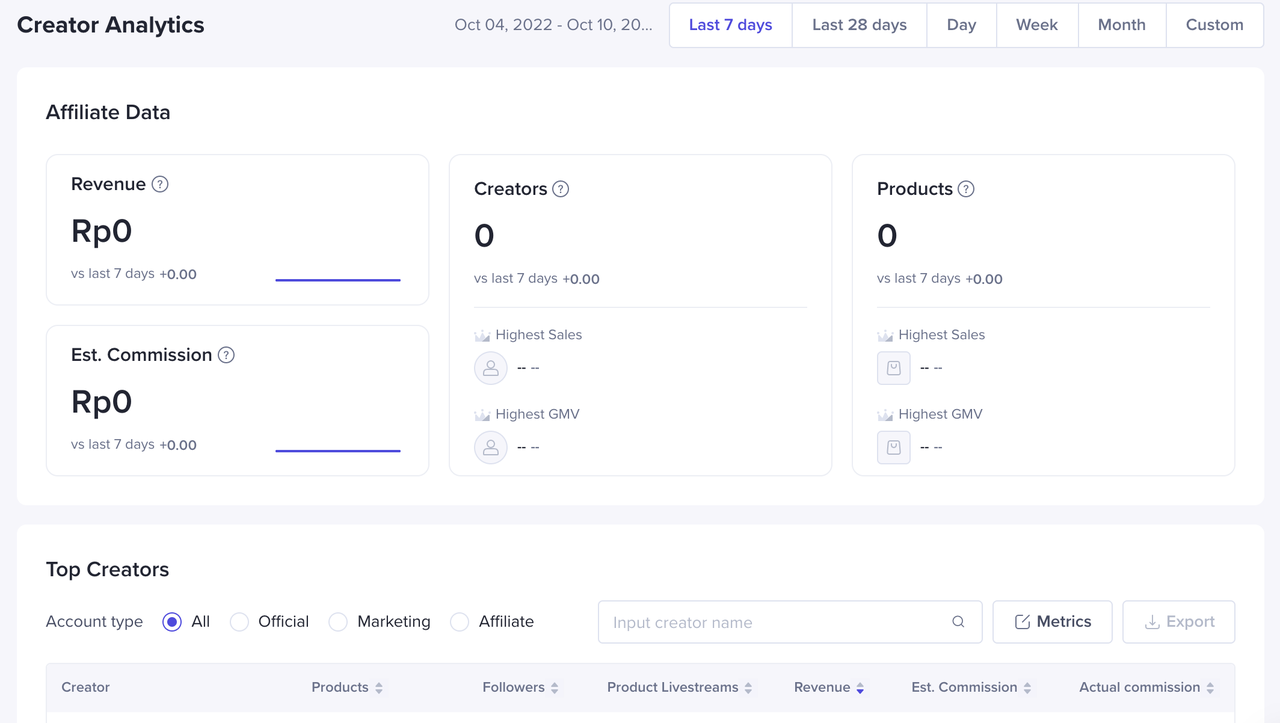
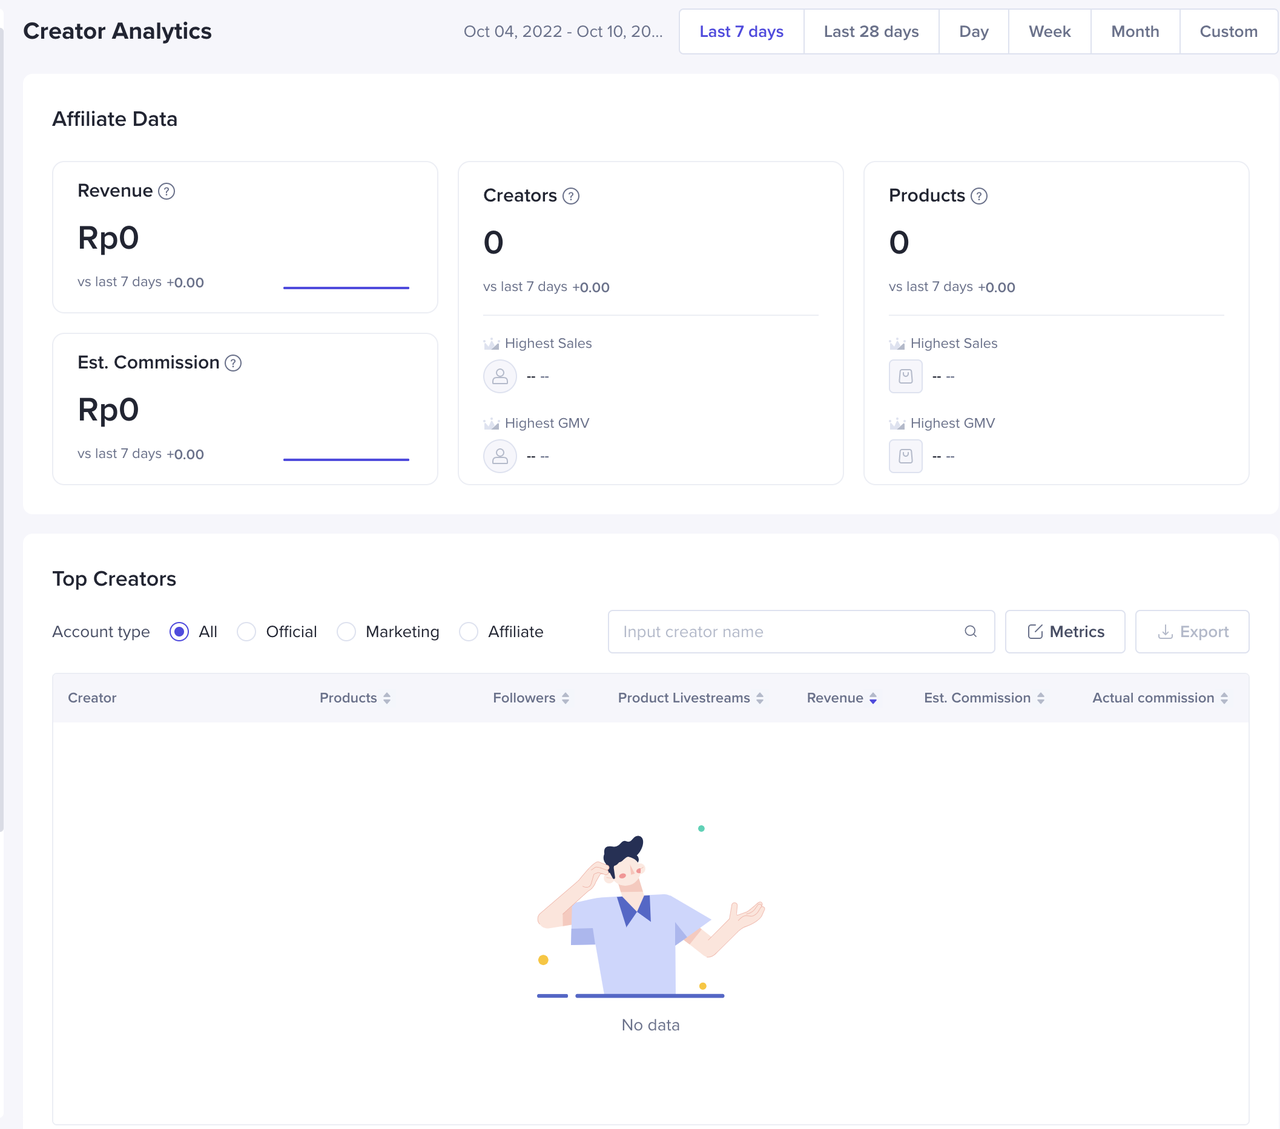
- Goal: Present the efficiency of cooperation between merchants and creators in the selected time period, view the opening and transaction status of TOP creators, and locate the most popular creators in the near future
- Approach:
Method 1: Check the transaction amount of cooperating creator affiliates, the number of cooperating creators and merchandise sales, understand users' favourite creators and products, compare the changes of TOP creators and products sold by creators in different cycles, and find out which creators or products sold by creators have increased in popularity and which creators or products sold by creators have decreased in popularity
Method 2: Check the creators with TOP traffic, find out which products the consumers are most interested in, compare the number of followers of TOP creators and the turnover with products, dig out the creators with high efficiency of turnover with products, and review the operation direction of creators with products
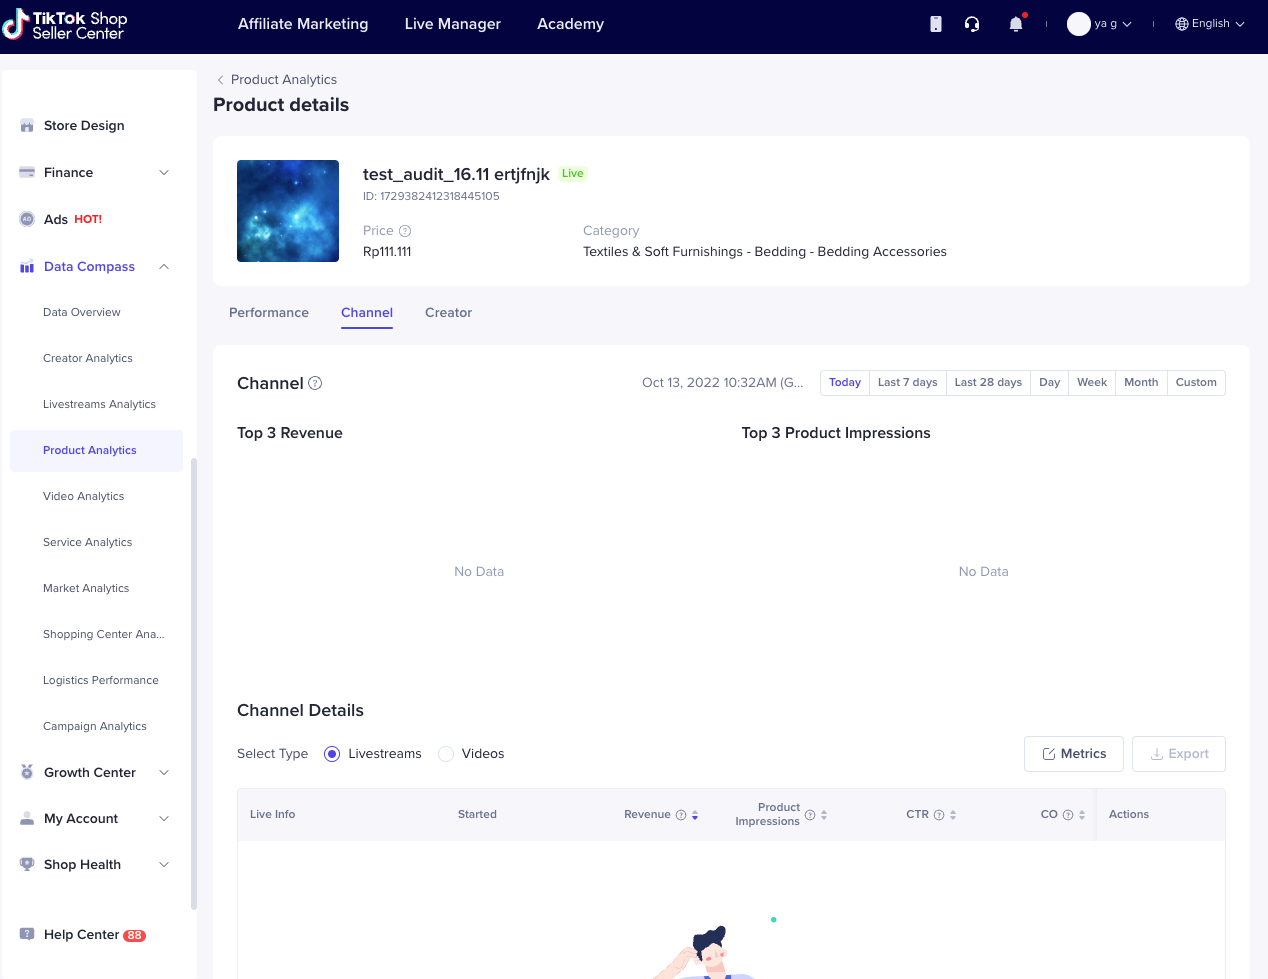
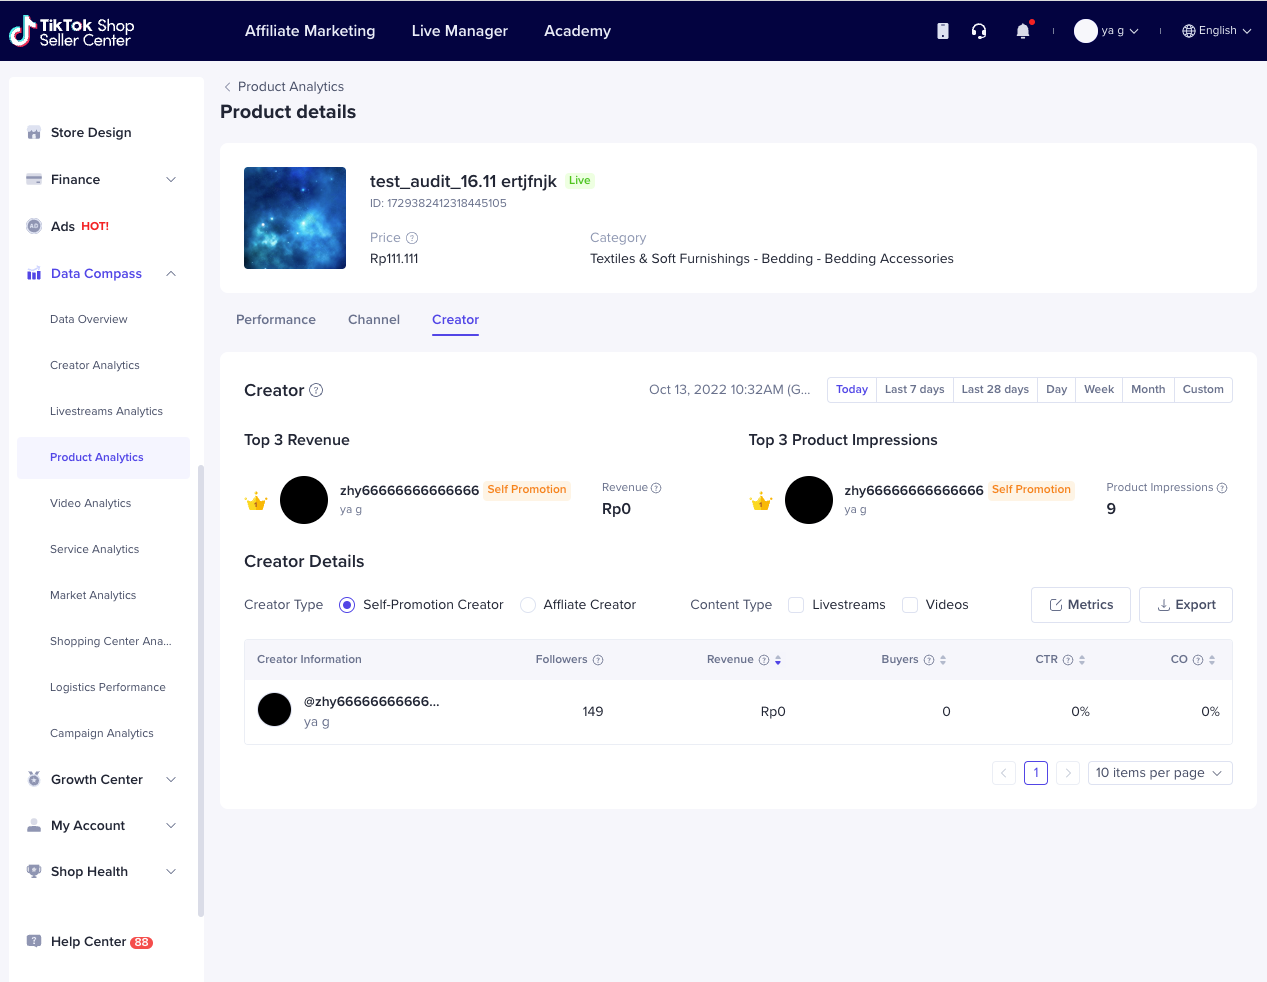
Product Analysis
- Goal: Help sellers monitor and offline analyse the data performance of each product in the shop in real time, analyse product performance, and assist sellers in daily product management
- Approach:
Method 1: Monitor the performance of the shop's product summary data in real time, discover real-time top transaction and top traffic products, and understand the real-time inventory of products
Method 2: Check the historical data performance of all products in the shop, analyse the performance of the products from the aspects of product transaction, product traffic, conversion efficiency etc. and make adjustments to the operation strategy
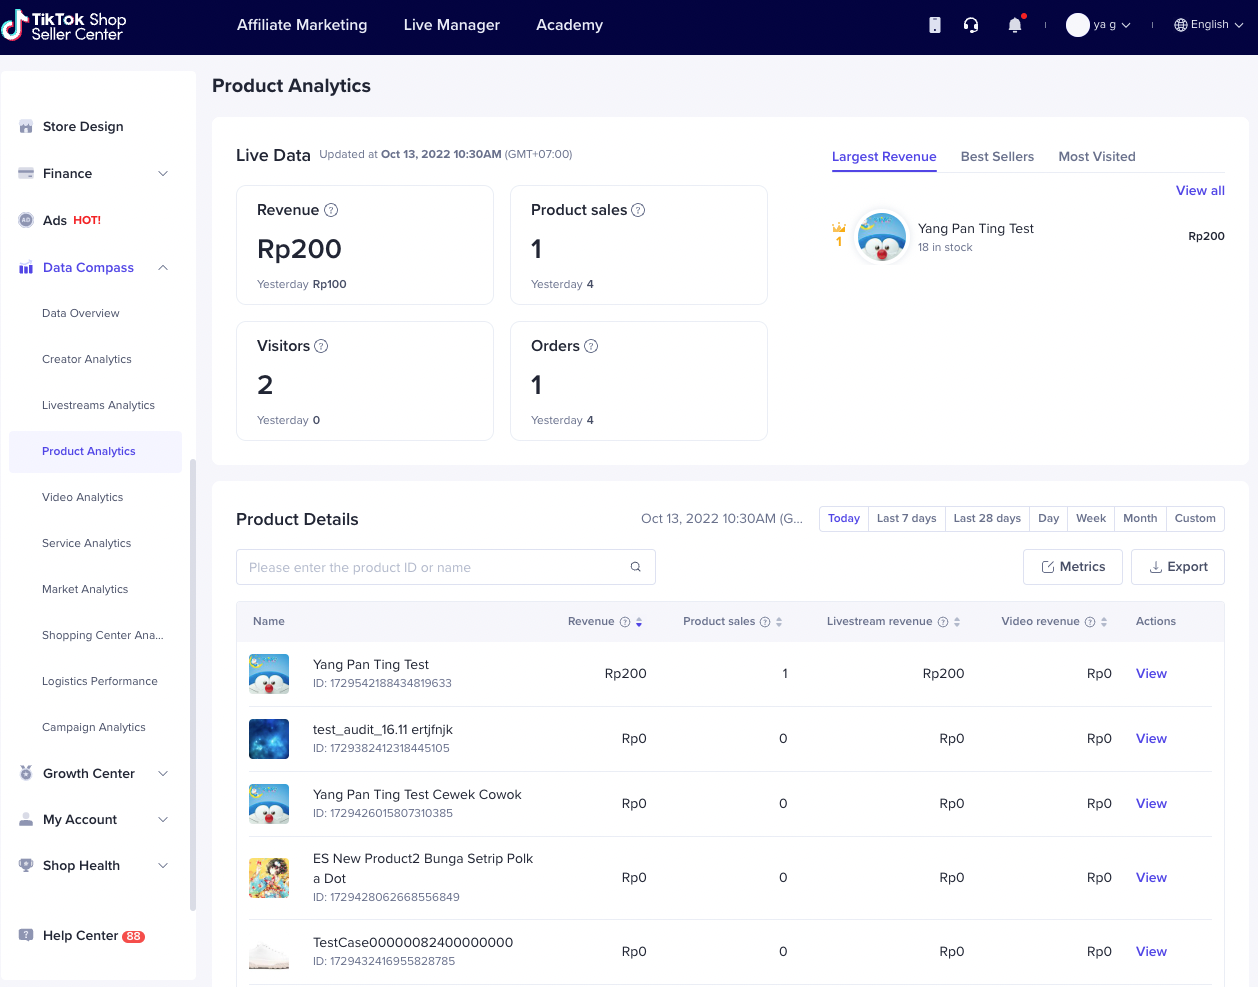
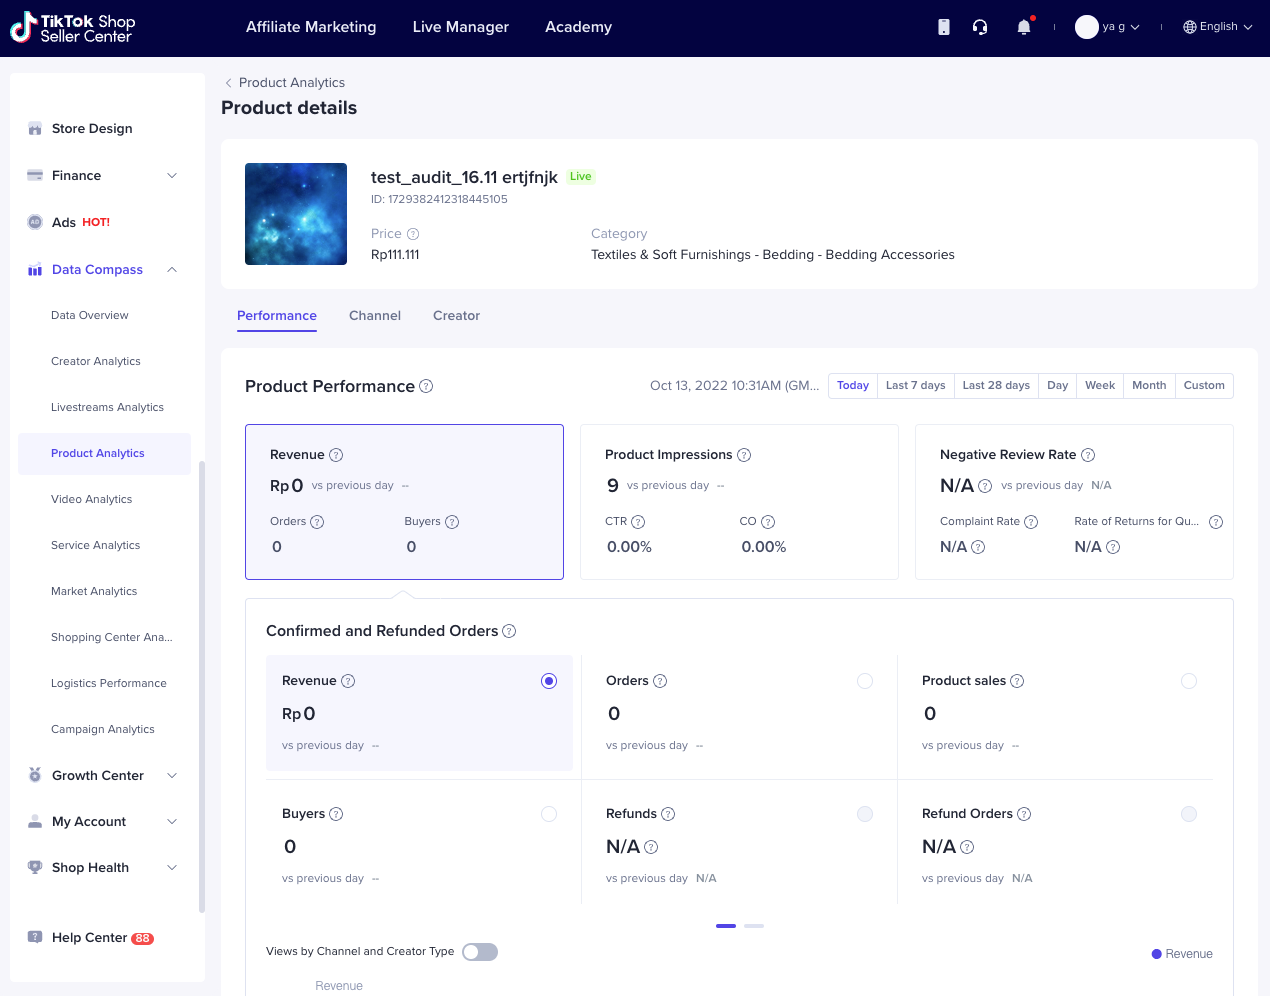
- Goal: Help sellers locate the reasons for the sudden increase or decrease in the transaction of the product, find the livestream/video/creator that brings the most transactions to the product, choose the most suitable promotion method for the product, and improve the shop transaction
- Approach:
Method 1: Enter the details page of the high-transaction product, select the transaction amount (default), and at the same time pull down to view the sales of different SKUs of the product, find the high-selling SKU, and flexibly plan the stocking and inventory preparation of different SKUs
Method 2: When it is found that the transaction or traffic of the product suddenly increases, enter the product details page, select the transaction or product exposure indicator, view the trend chart, locate the time point when the traffic suddenly increases, and then enter the [Channel] and [Creator] tabs, check the livestreams/videos/ creators that brought transactions to products, and find out the reasons for the transaction or the sudden increase in traffic
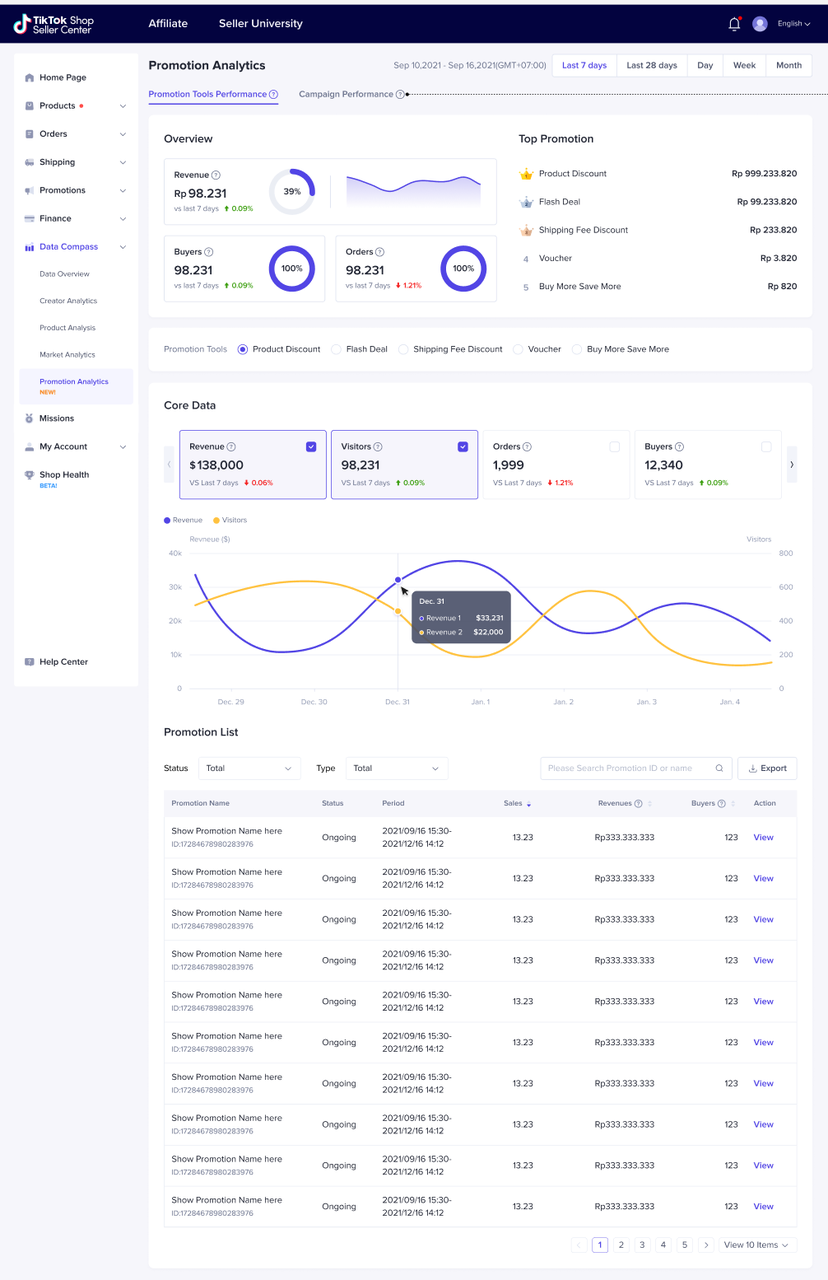
- Goal: Data Compass launches promotion tool analytics to help merchants understand the overall revenue/ranking/ROI of different promotion tools such as product discount/flash deal/voucher/shipping fee discount/buy more save more, and supports merchants viewing the effect of each created promotion activity to help merchants analyze the best promotion tools to use.
- Using Strategy:
Method 1:An intuitive understanding of the promotion tools that bring the most revenue to the store, and the ranking of the different promotion tools.
Method 2:Understand the strength of discounts and yields of different promotion tools and analyze how to get a higher return using a smaller cost.
Method 3:Understand the status of each activity and its conversion efficiency, and summarize better activity strategies.
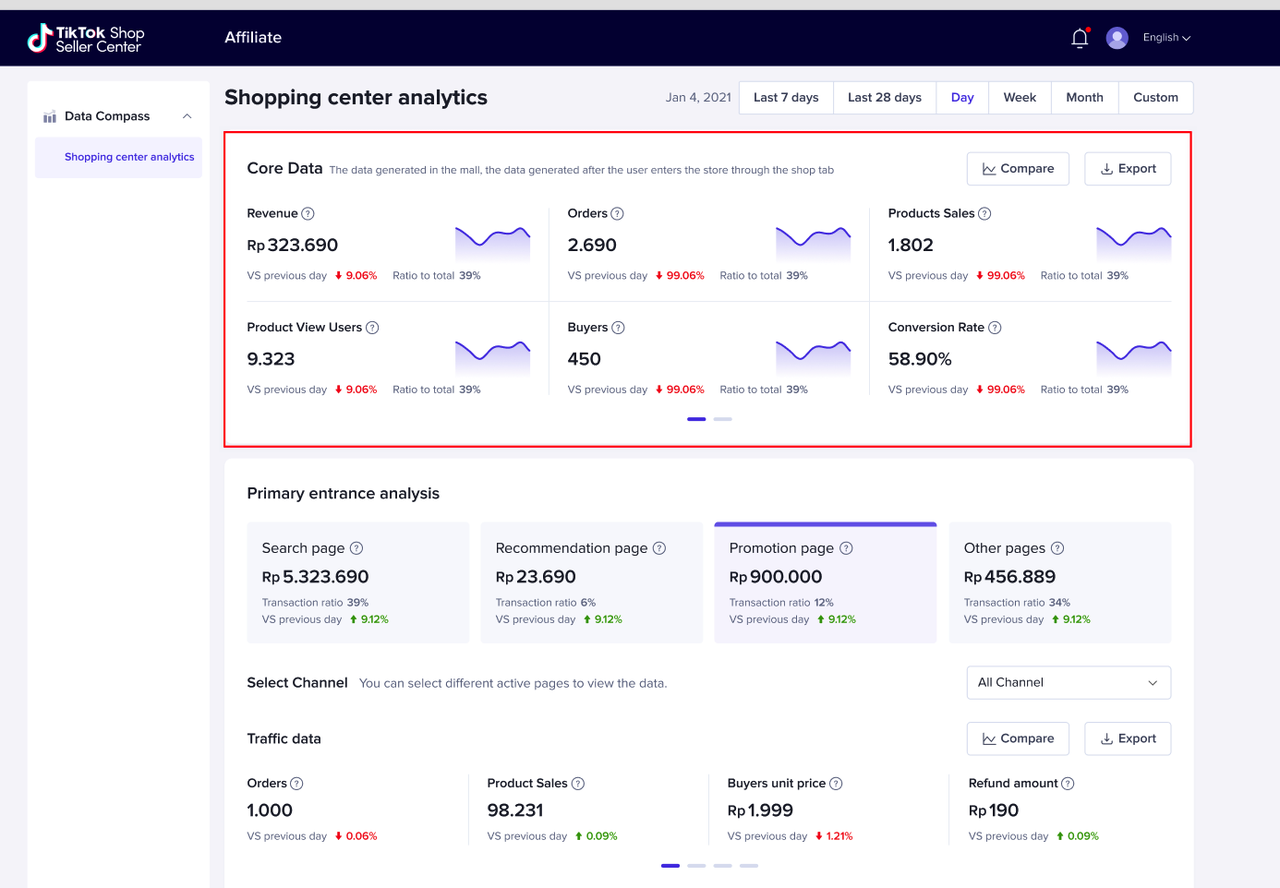
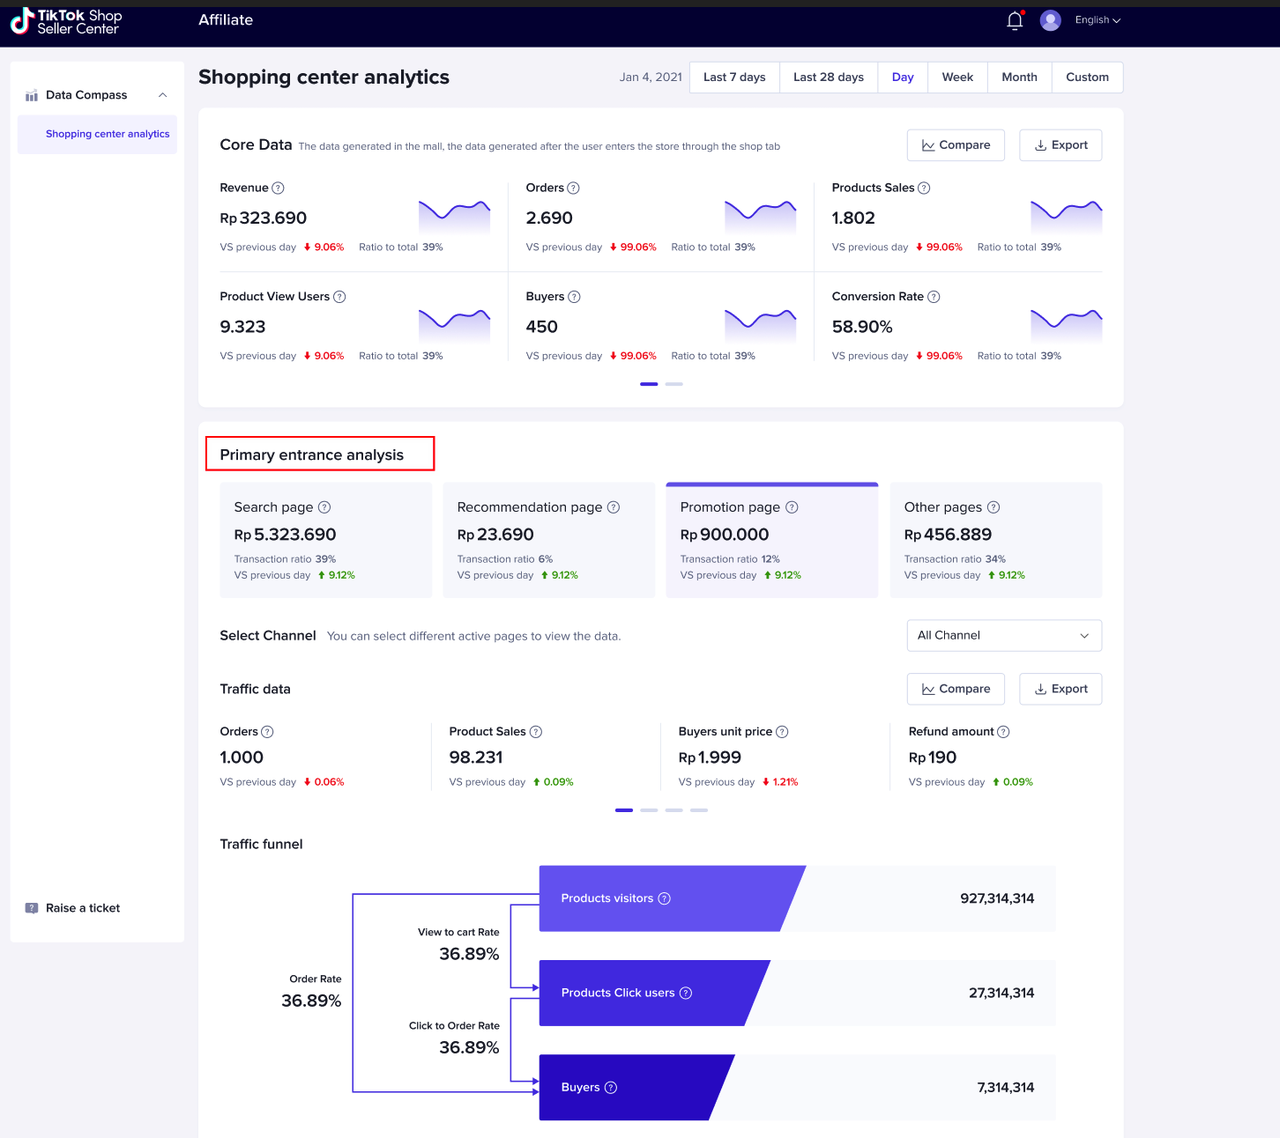
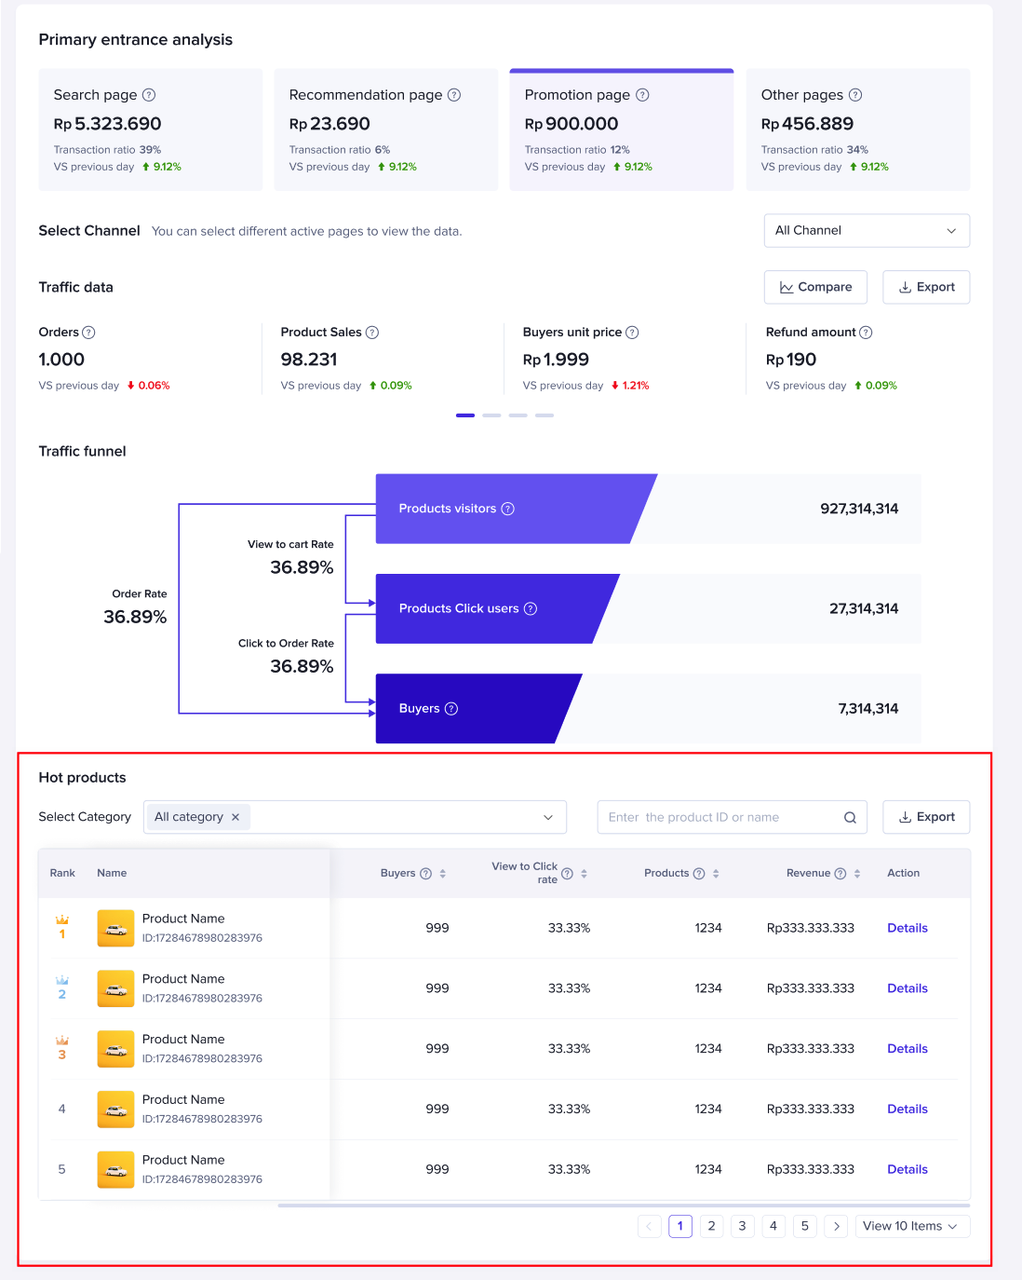
- Goal:Help sellers see the transaction data of the shopping center, analyze the distribution of non-content traffic channels, change trends, identify key channels, and deeply analyze product performance, so as to optimize product strategies
- Using Strategy:
Method 1: Overall data of the shopping center: sellers can view the transaction amount, transaction orders, product exposure and conversion data of the shopping center according to the shopping center analysis page to understand the contribution of the shopping center to the store transaction, support clicking on the indicator trend to compare, and view the change trend of traffic, orders or conversion metric
Method 2: Divide vertical channels: sellers can view the conversion funnel of vertical channels on the shopping center recommendation, search, and promotion pages, and intuitively see the transaction data and conversion efficiency of this channel, so as to understand which channels the store is currently getting more traffic, which channels are relatively weak, so as to stabilize the products of good channels, and optimize the products of channels with a low proportion
Method 3: Commodity transaction details: Through the list of hot-selling products in the channel, sellers can identify products with good sales volume, high conversion and low conversion, and try to maintain stability for products with good sales to avoid frequent modification. For products with high conversion, consider adding content correlation to improve the basic exposure of the product. For products with low conversion, they can optimize basic information to improve the conversion rate
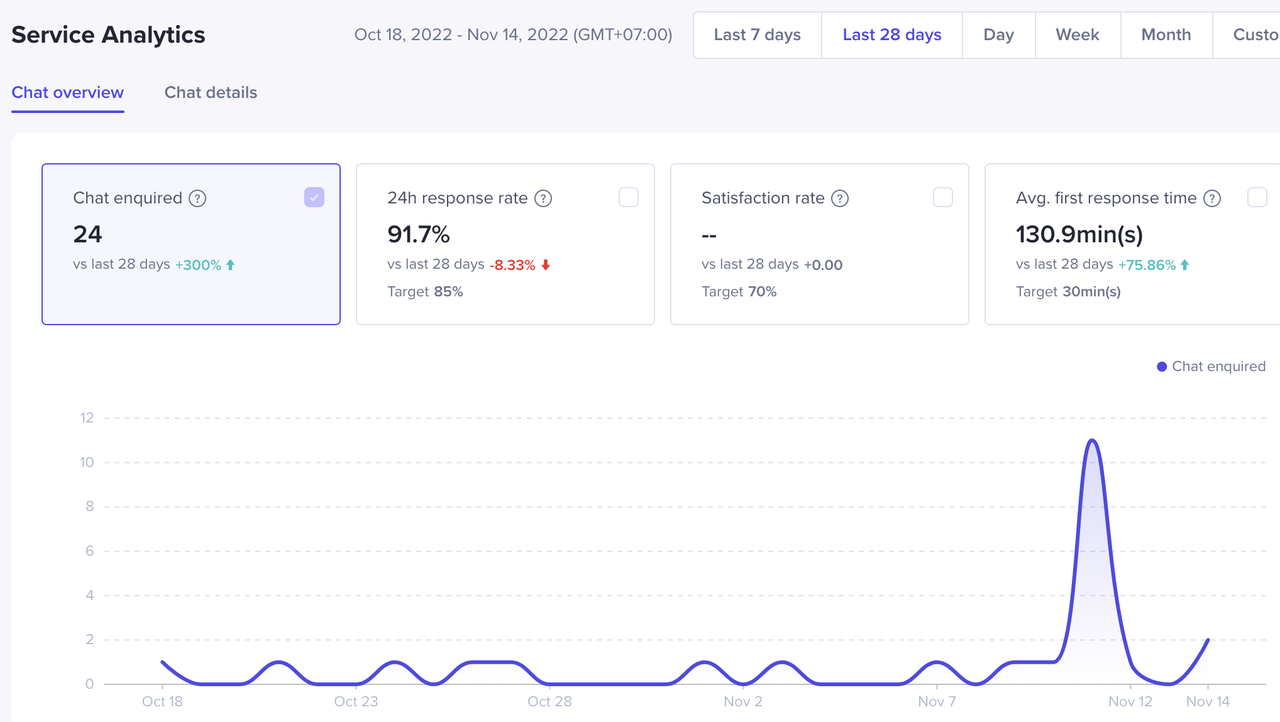
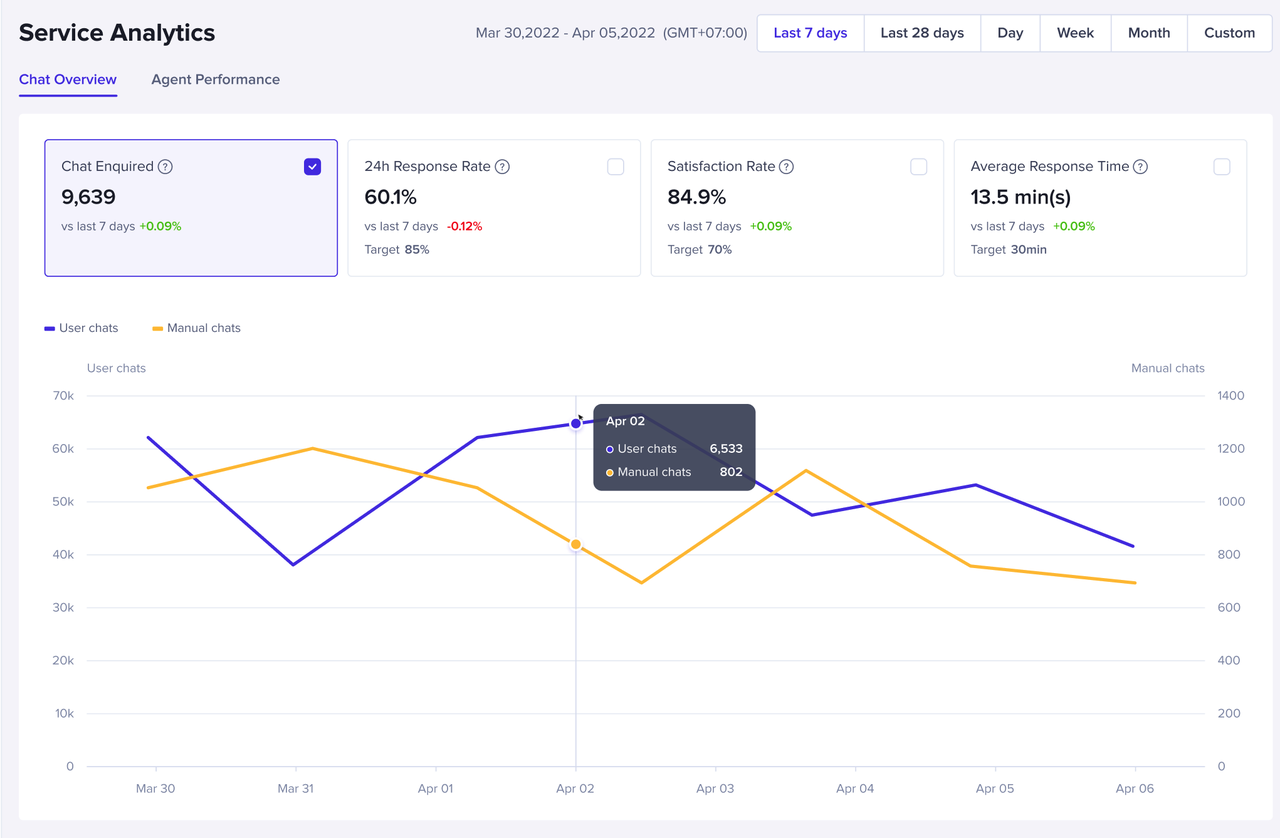
Service Analytics
- Goal:Customer service analysis is mainly to provide sellers with real-time monitoring of customer service level data, so that sellers can monitor changes in metric,and in time to identify customer service performance
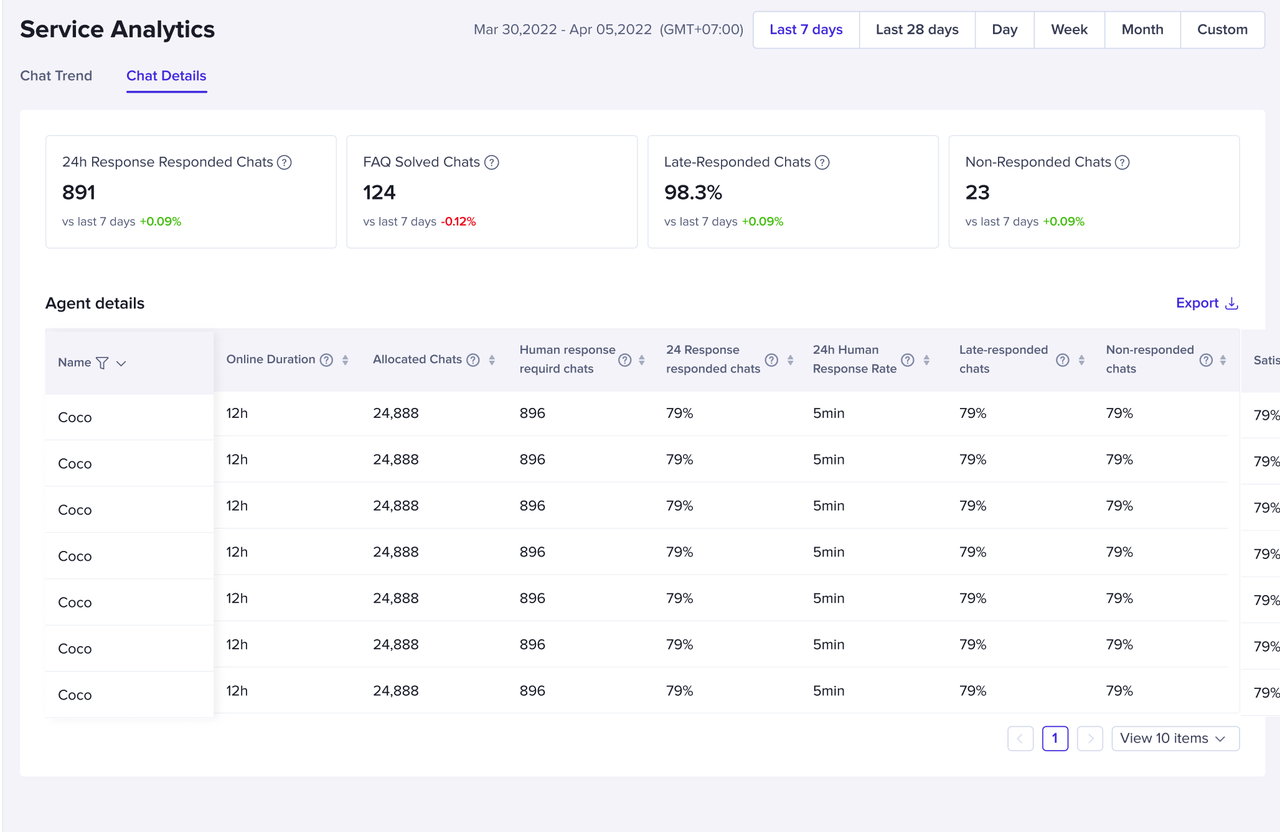
- Using Strategy:
Method 1: Core metrics monitoring, Customer service analysis will provide metric such as Chat Enquired, Average Response Time, Satisfaction rate, and Response Rate of customer service in the past 24 hours, so that sellers can see the overall customer service performance. The indicator card will be accompanied by the current platform assessment standard goals. Sellers need to pay attention to avoid being punished after exceeding
Method 2: Customer service performance monitoring: Customer service analysis tab2 will provide the 24h Human Response Rate,Late-Responded Chats , mainly check the amount of inquiries, manual responses and intelligent reception ratio, determine whether the number of customer service needs to be adjusted, and provide the recent performance data of each customer service, which can more clearly judge the customer service satisfaction.