Product card performance: Know more about traffic source distribution and conversion efficiency
06/16/2023
❓Are you curious about where traffic and revenue come from besides live and videos❓
❓What proportion do product cards contribute to the overall traffic and revenue❓
❓How to operate and analyze the product card traffic and revenue❓
What are product cards?
- What are product cards: Product cards are cards that display product information in the e-commerce shelf scene, and merchants can gain product exposure through product cards after listing their products.
- From the traffic perspective: When customers click to enter the product details page through search, recommendation, shopping center channel, store and showcase, the product card traffic is generated.
- From the revenue perspective: Revenue generated through non-live and non-video channels are considered product card revenue.
| Content type | Search | Recommendation | Promotion | Store | Showcase | |||||||||||
| Traffic type | Organic traffic | |||||||||||||||
| User side (screenshot) | Search on the TikTok homepage 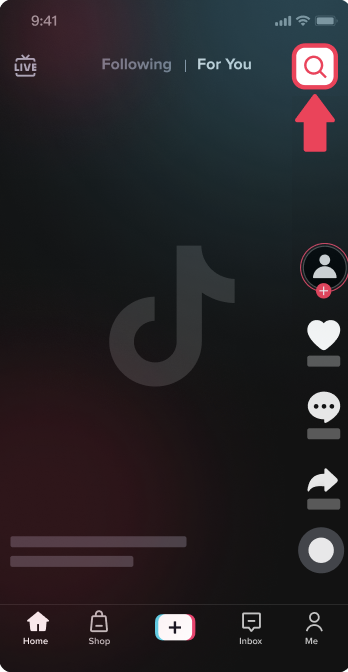 | Search on the shopping center homepage 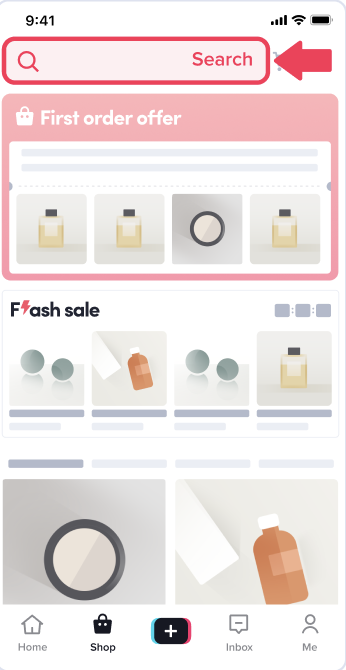 | Search result page 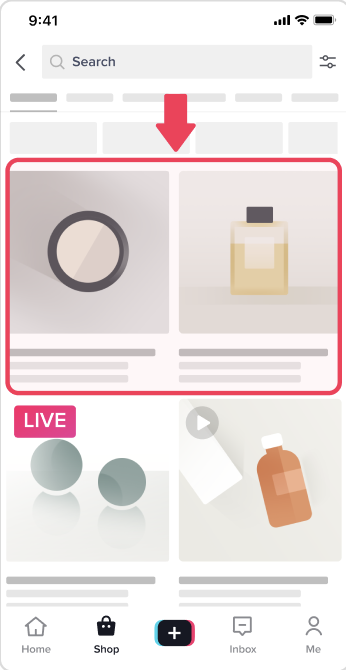 | Recommendation of the shopping center 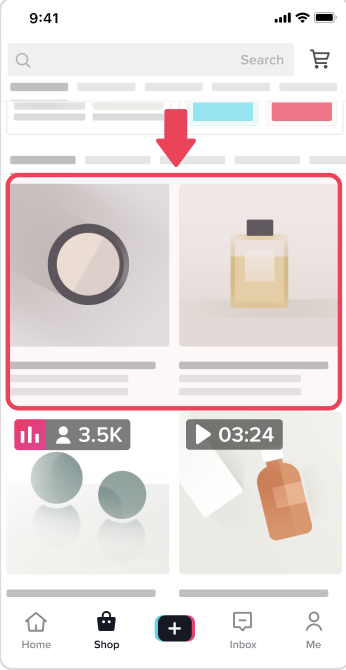 | "May be you like" on PDP 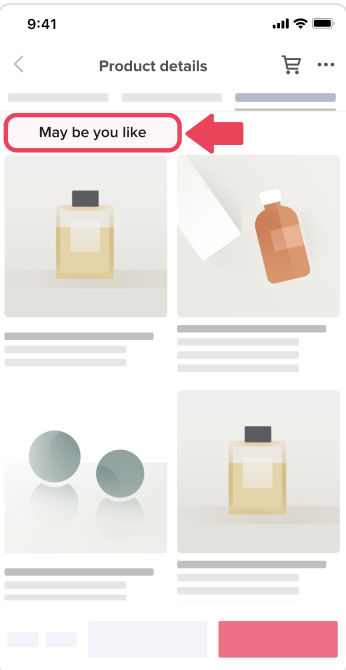 | Same store products on PDP 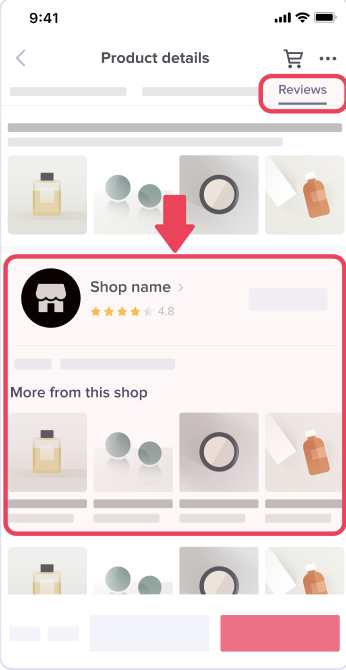 | Add-on page 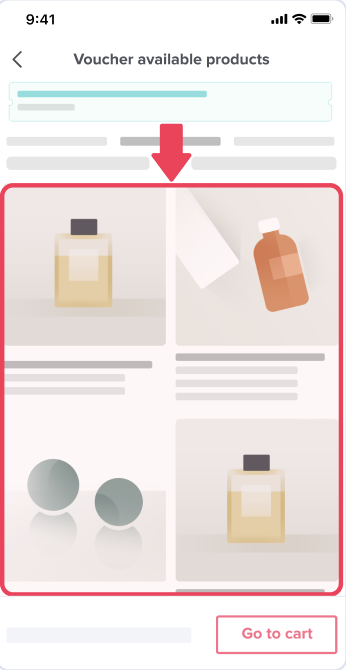 | Order center 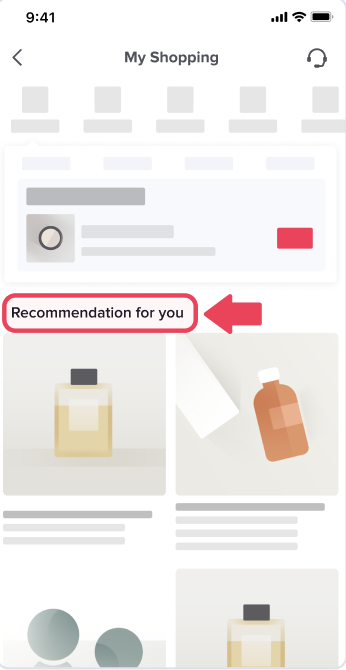 | "Flash sale" of shopping center 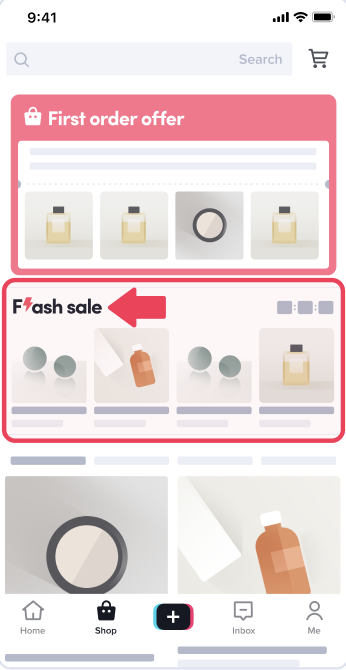 | "Brand & Budget" of shopping center 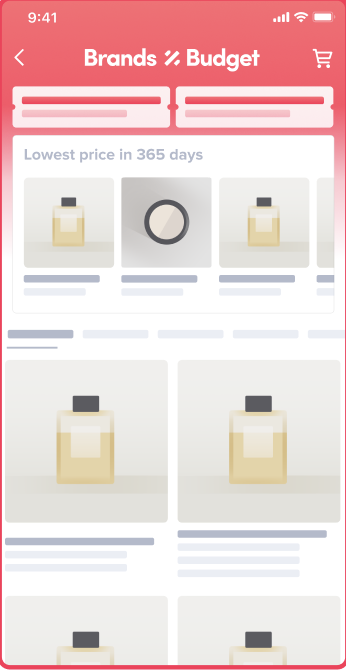 | "First order offer" of shopping center 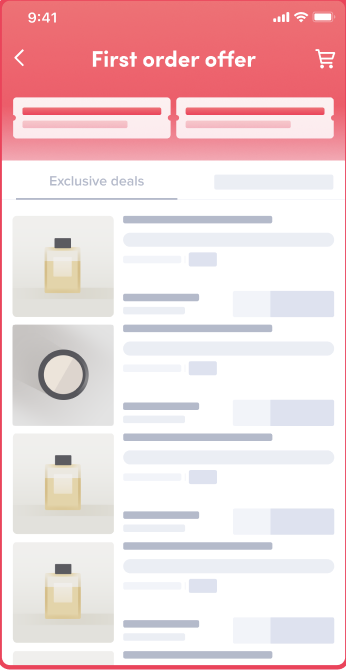 | "Store" of shopping center 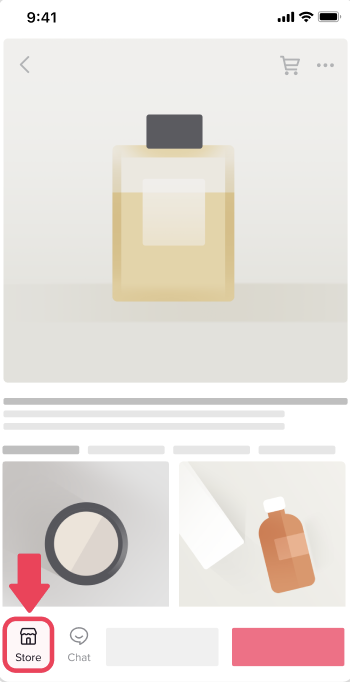 | Official store entrance 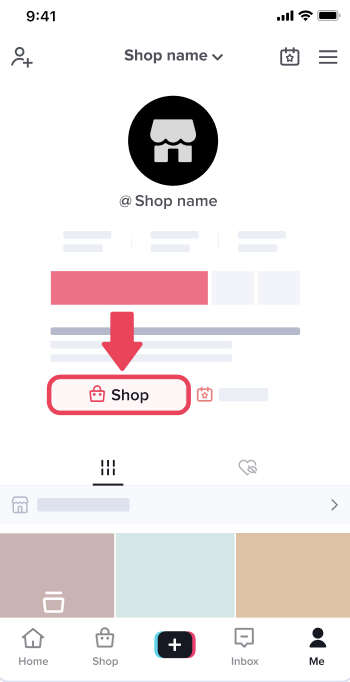 | Store page 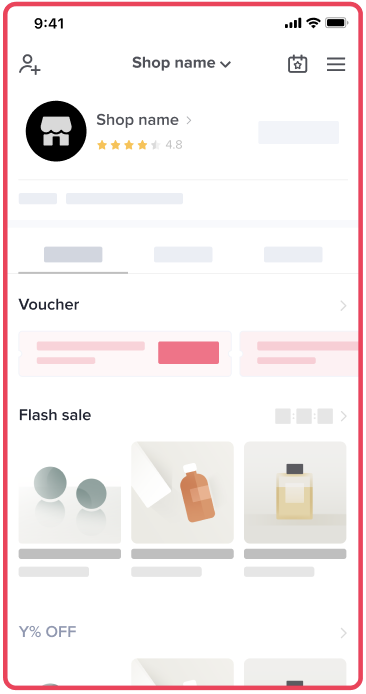 | Showcase entrance 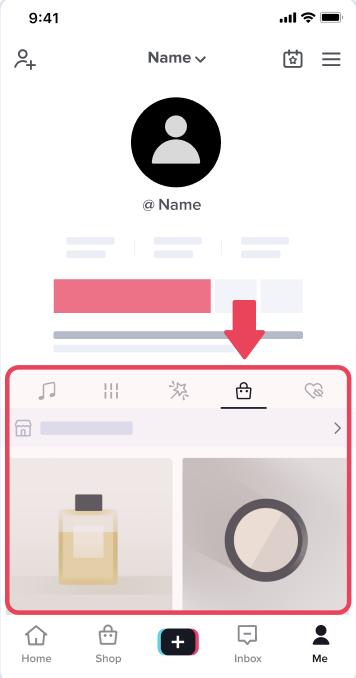 | Showcase page 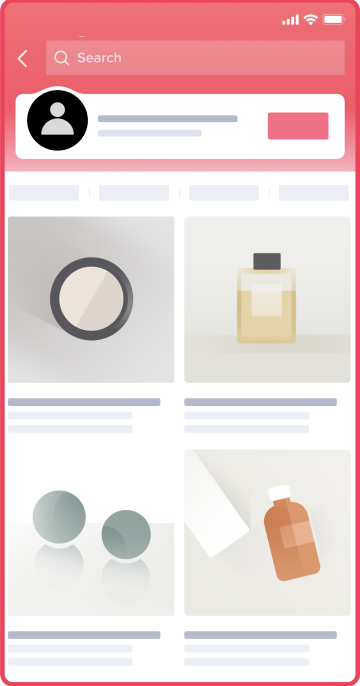 |
Benefits of Product Card Performance Analysis (by scenario)
🌟Scenario 1: Understand the traffic and revenue source distribution of product cards.
You can view the overall revenue and traffic performance of product cards in [Core Data].In [Traffic Source], you will see how much traffic and revenue come from search, recommendation, shopping center channel, store and showcase, so as to identify the channel that can generate the most traffic and revenue.You can click [View trend] to view the traffic and revenue trends during the selected time period.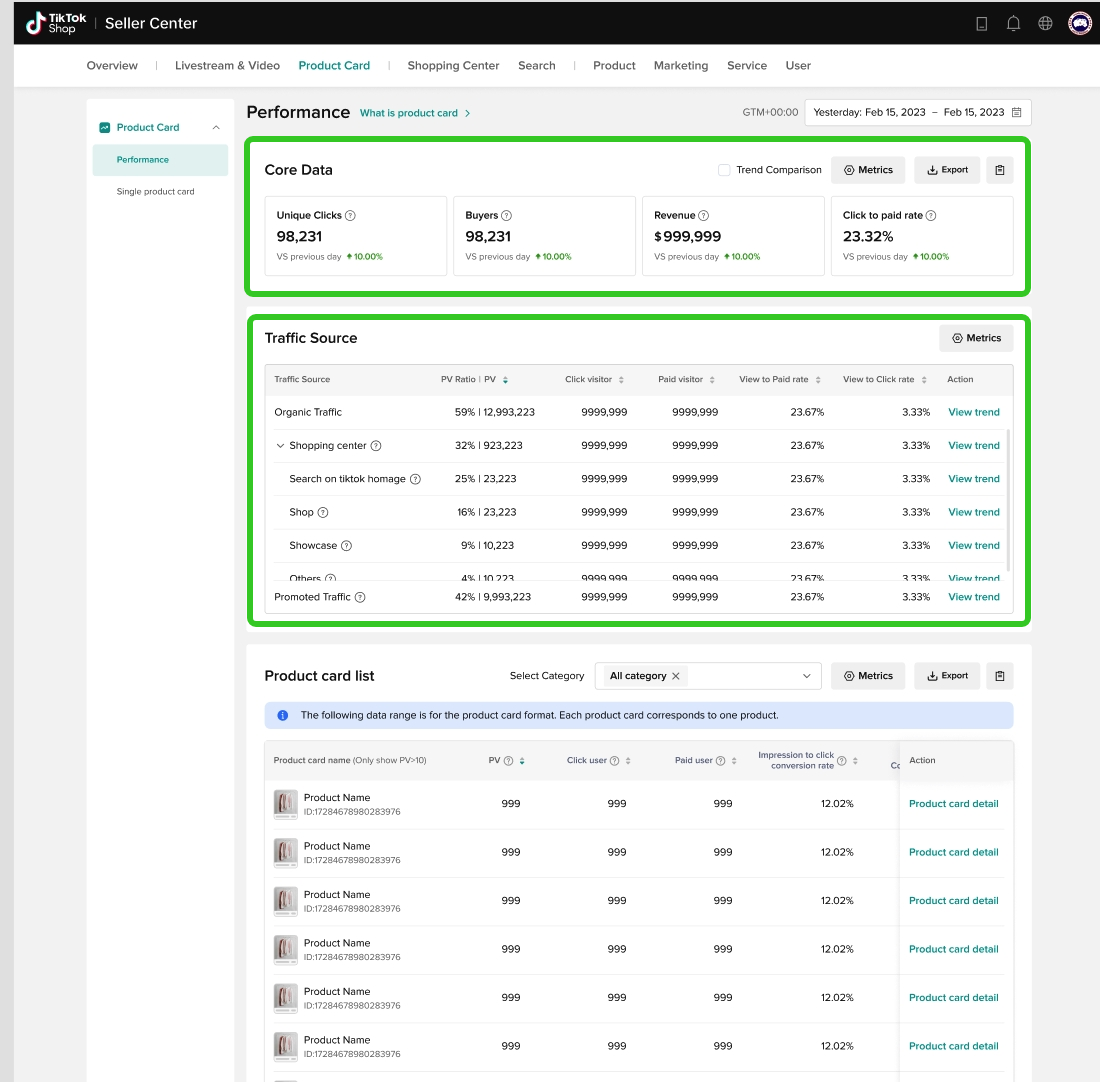
🌟Scenario 2: View the ranking list of the most popular product cards.
You can view the revenue and traffic performance of each product card or filter by product category. Moreover, you can rank product cards by traffic and revenue metrics to find the most popular product card.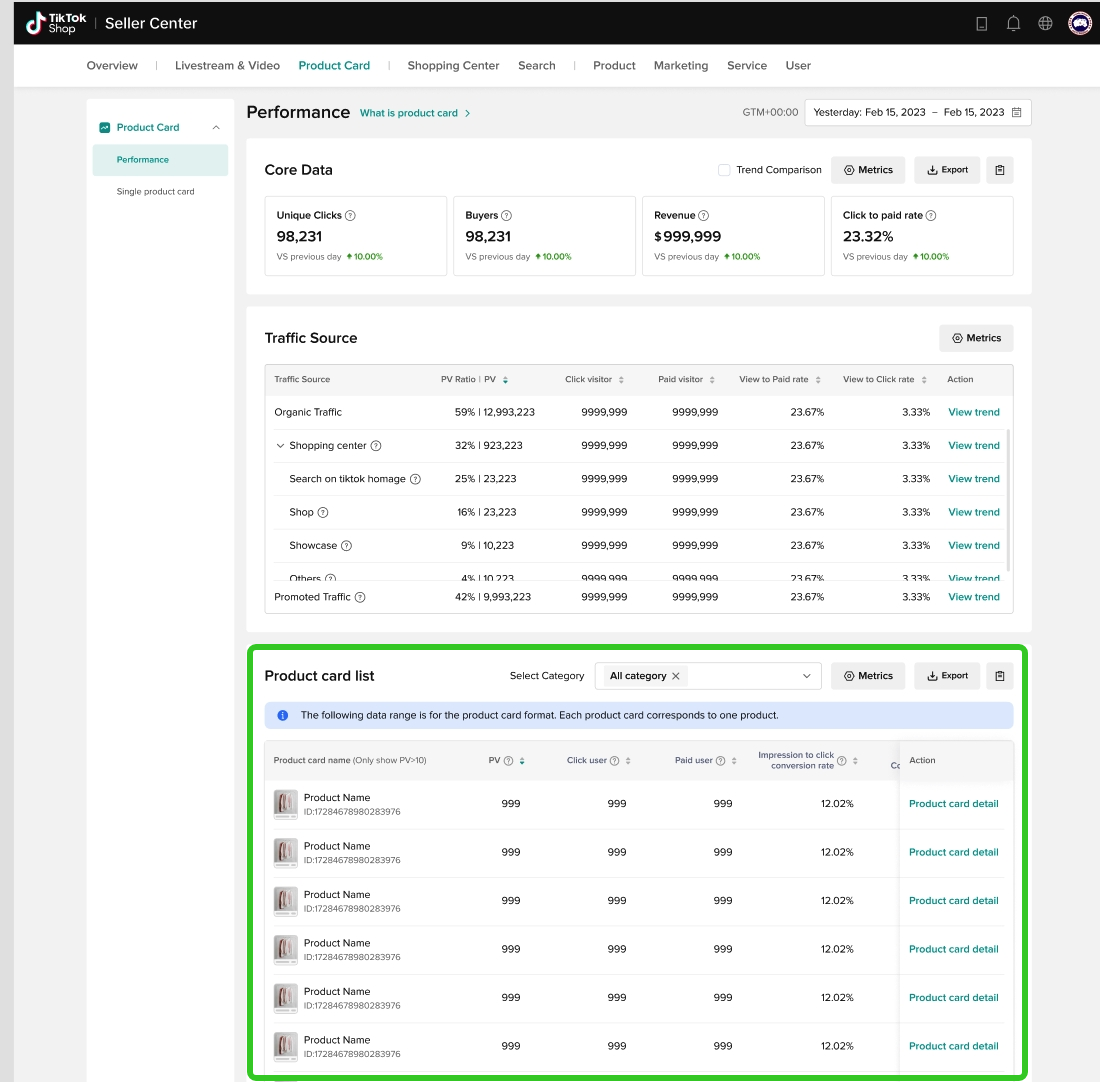
🌟Scenario 3: Search for a certain product card and view its traffic source and conversion funnel.
On the [Single product card] page, you can search for a product card that you are interested in, while the data compass will also recommend some top views and revenue product card for you to select. After clicking and entering the [Single product card] page, you can see the revenue and traffic funnel, which can help you understand the conversion from exposure to click, from click to add-to-cart and from add-to-cart to payment. It helps you find out at which stage the product card loses the most customers. For different stages, you can adopt different optimization strategies. For example, if the "exposure to click" conversion is low, you can improve the picture and title to attract more customers to click the product details page. If the "click to add-to-cart" conversion is low, you may need to enhance the description of the product functions and offer a more attractive price. If the "add-to-cart to payment" conversion is low, you can provide more promotional tools such as vouchers to improve the conversion. Moreover, you can view the traffic source distribution of each product card.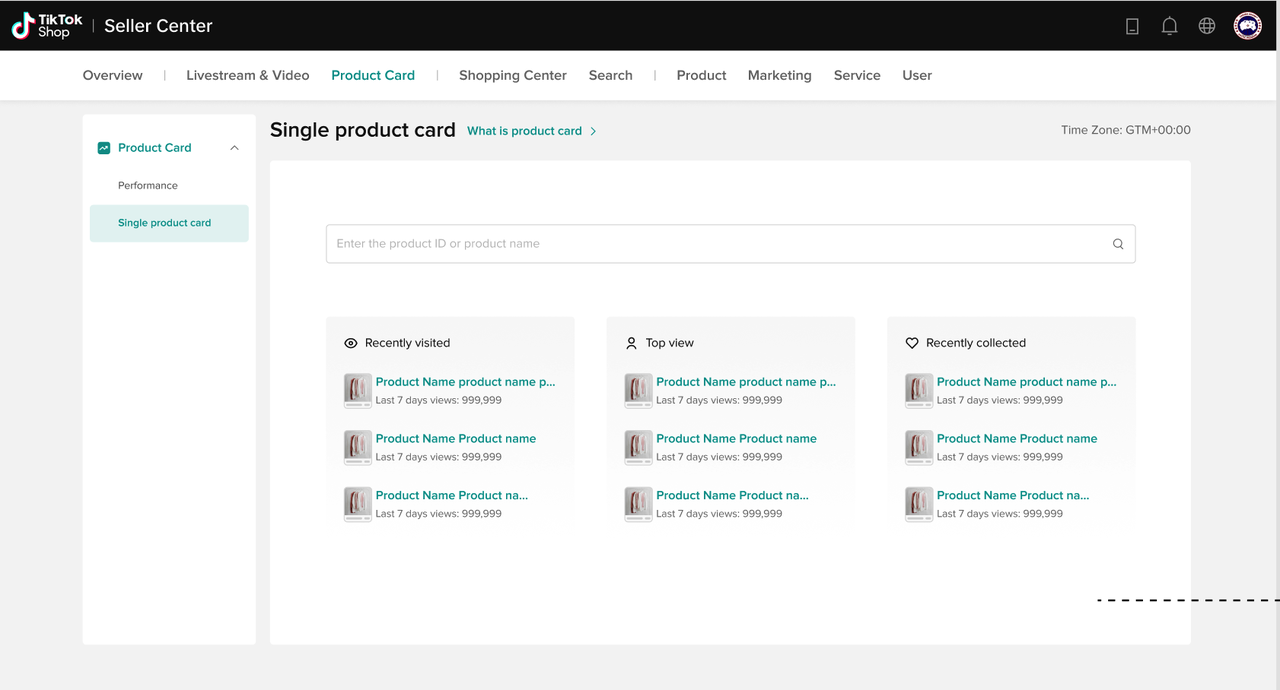 | 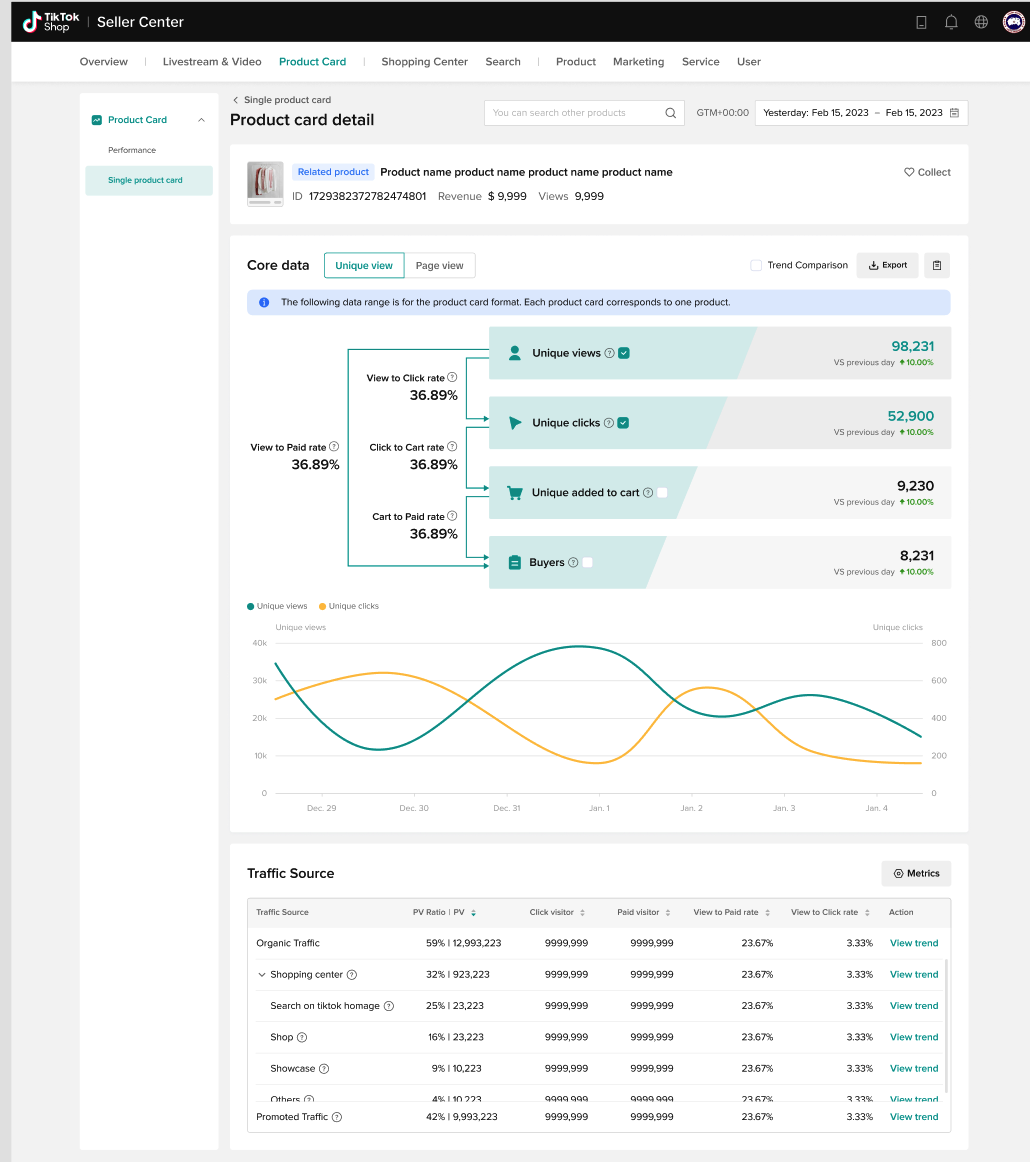 |
How to use the product card performance analysis feature?
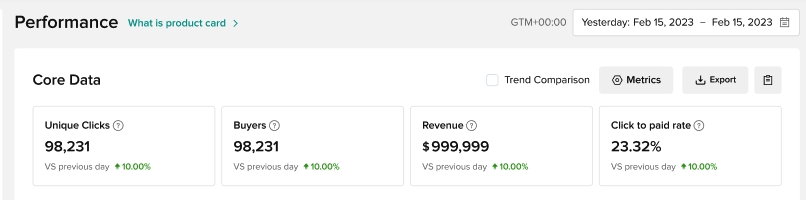
Product card performance
Core data
This part will show the core metrics of overall product card performance:- Unique clicks
- Buyers
- "View to Paid" Rate
- Revenue
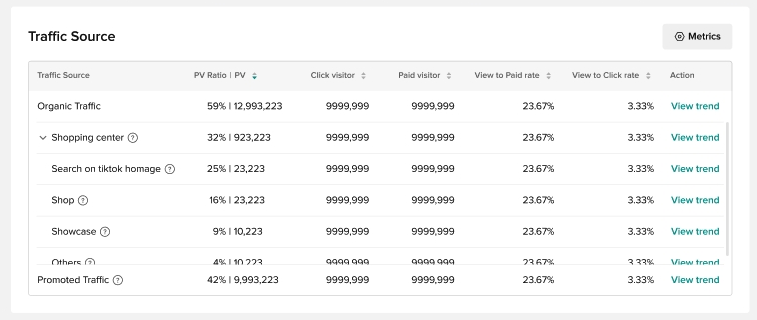
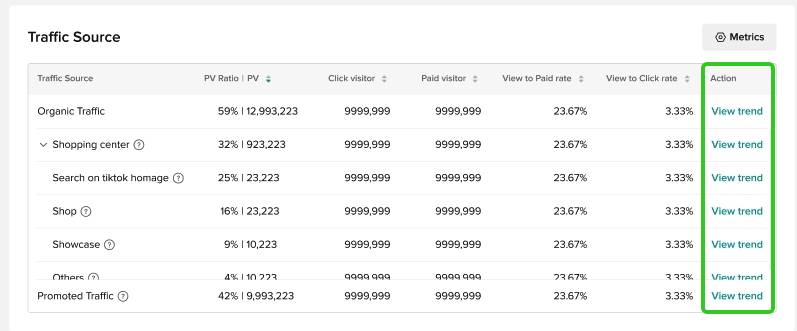
Traffic source
This part shows you where the traffic comes from:- Organic traffic:
- Search:
- Search in the shopping center
- Search on the TikTok homepage
- Recommendation:
- Recommendation of the shopping center
- Other recommendation pages
- Promotion :
- Flash sale of shopping center
- Brand & Budget of shopping center
- First order offer of shopping center
- Store
- Showcase
- Other: Other traffic in addition to the above channels
- Search:
- Paid traffic
- Views - PV (proportion)
- Unique views
- Unique clicks
- Buyers
- "View to Paid" Rate (UV)
- "View to Click" Rate (UV)
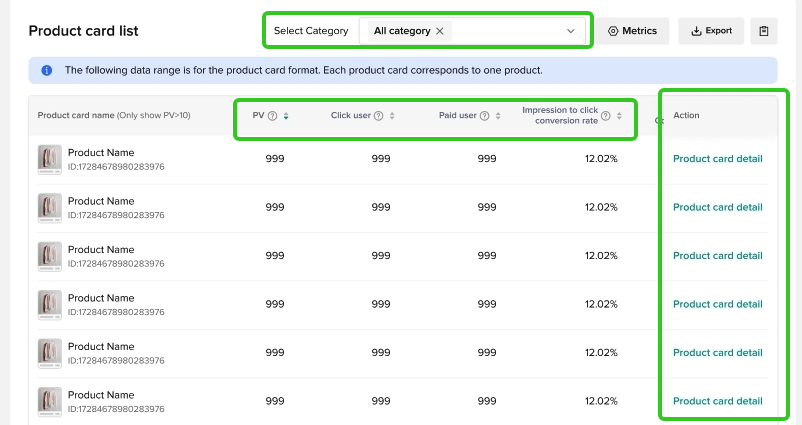
Product card list
You can view the revenue and traffic performance of each product card or filter by product category. Moreover, you can rank product cards by traffic and revenue metrics to find the most popular product card:- Unique views
- Unique clicks
- Buyers
- "View to Paid" Rate (UV)
- "View to Click" Rate (UV)
- Revenue
- SKU order
- Click [Product card details] to view the performance of a single product card.
Single product card
Search product card
On the [Single product card] page, you can search for a product card that you are interested in, while the data compass will also recommend some top views and revenue product card for you to select.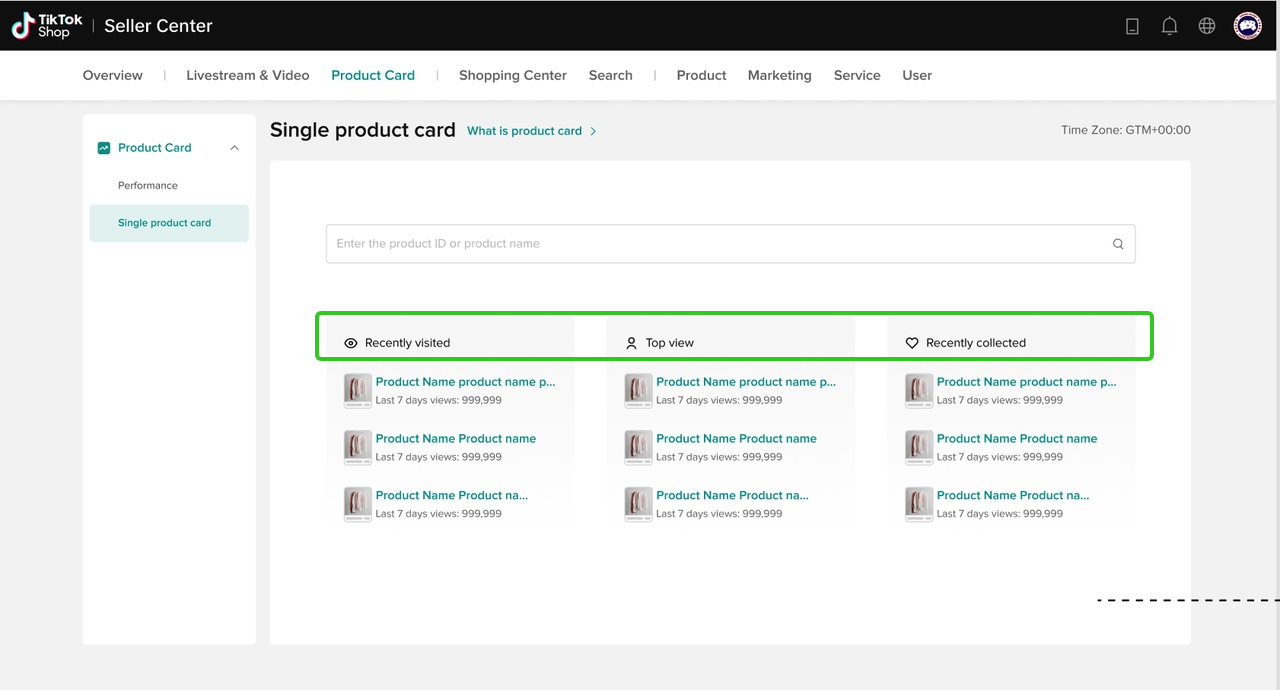
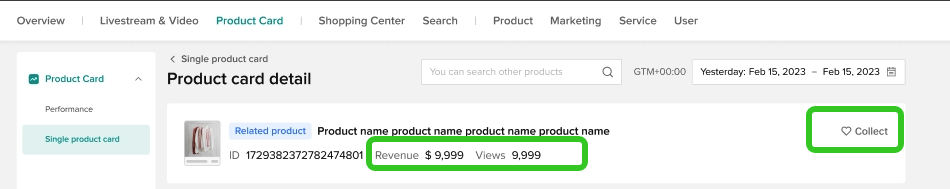
Single product card performance
Basic Information- It will show the revenue and views of the product card.
- "Collect" a product card: click [Collect] to make it easier to search for this product card.
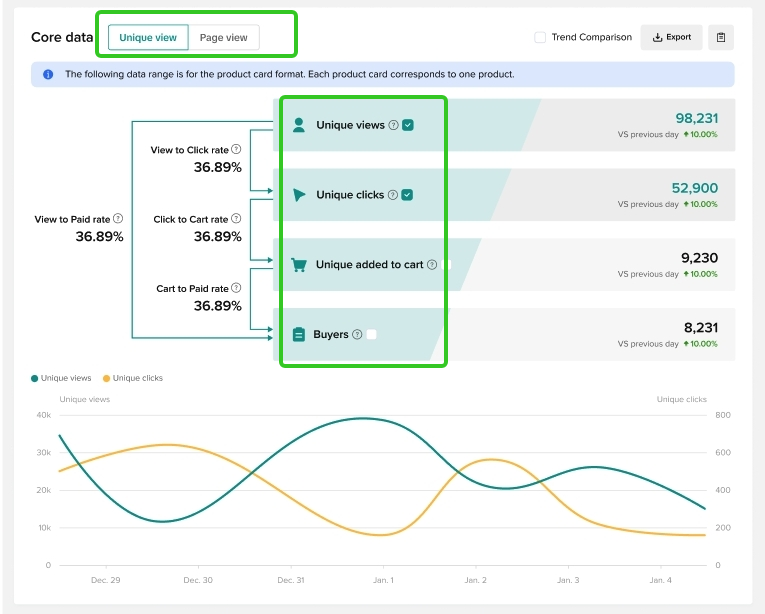
 Conversion funnel
- After clicking and entering the single product card page, you can view the traffic funnel, which can help you understand the conversion from exposure to click, from click to add-to-cart and from add-to-cart to payment.
- Unique view (UV) conversion:
- Unique views
- Unique clicks
- Unique add-to-Cart
- Buyers
- Page view (PV) conversion:
- Views
- Clicks
- Add-to-cart count
- SKU Orders
- Unique view (UV) conversion:
- You can also see the trends of unique views and unique clicks.
 Traffic sourceThis part shows you where the traffic comes from:
- Organic traffic:
- Search:
- Search in the shopping center
- Search on the TikTok homepage
- Recommendation:
- Recommendation of the shopping center
- Other recommendation pages
- Promotion:
- Flash sale of shopping center
- Brand & Budget of shopping center
- First order offer of shopping center
- Store
- Showcase
- Other: other traffic in addition to the above channels
- Search:
- Paid traffic
- Views - PV (proportion)
- Unique views
- Unique clicks
- Buyers
- "View to Paid" Rate (UV)
- "View to Click" Rate (UV)