Seller Center Data Compass

  1. Data Compass Introduction

By analyzing operational statistics generated by short videos and Livestreams, we are providing indicators to help merchants who want to continue operating analyze their performance in product quality, promotion channel, real-time review, recap, and other scenarios. We hope to help merchants understand their own operating conditions, adjust business strategies, and achieve sustainable business growth.
  1. Feature Module & Entrance

Module
Schematic diagram
Homepage
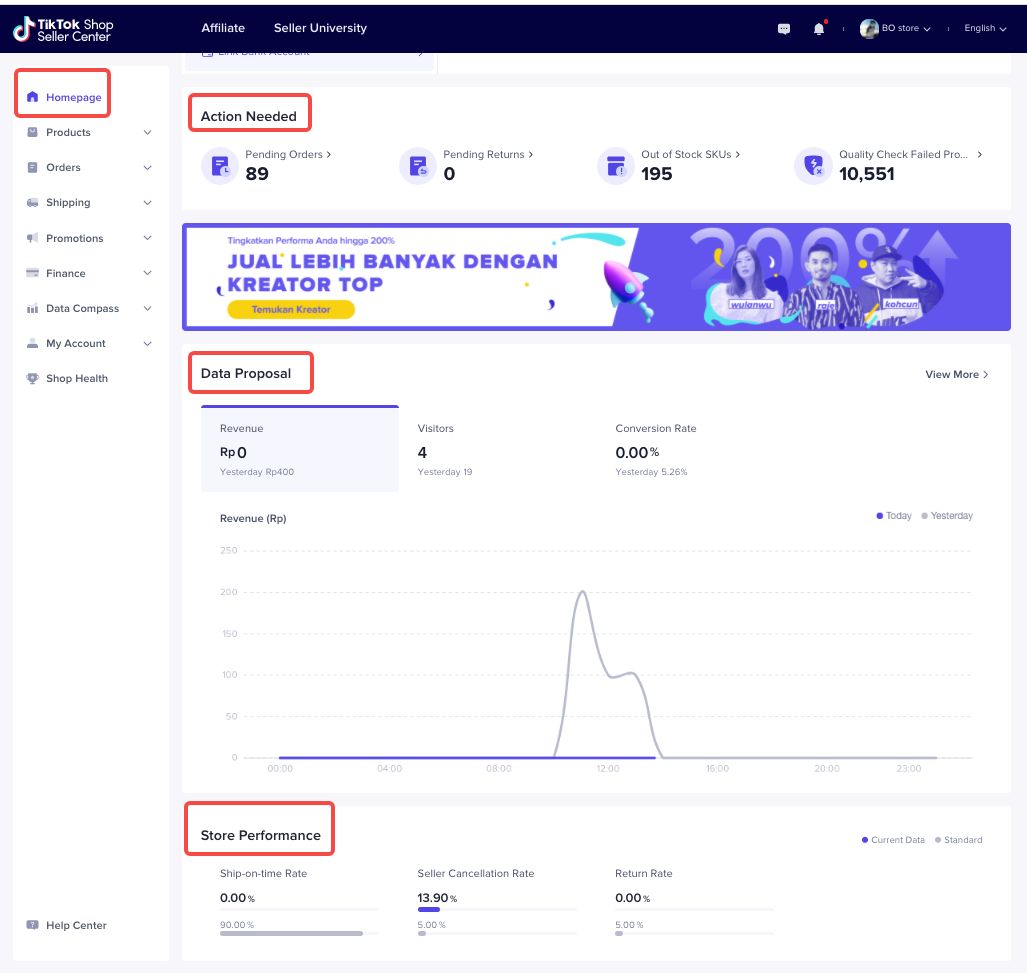
  • Action Needed
  • Data Proposal
  • Store Performance
image.png
Data Compass
Data Overview image.png
Creator Analytics image.png
Today's Livestreams image.png
Livestreams Analytics image.png
Product Analytics image.png
Video Analytics image.png
  1. Features

1 Homepage

Module
Function
Schematic diagram
Action Needed
  • Pending orders: Total number of orders waiting for processing. Click and jump to [To Ship] tab of the [Manage Orders] page.
  • Pending returns: Total number of the currently pending return/refund orders. Click and jump to [To proceed] tab of the [Manage Returns/Refunds] page.
  • Out of Stock SKUs:Number of SKUs with 0 stock. Click and jump to the [Sold out] part in the [Live] tab of [Manage Products] page
  • Quality Check Failed Products:Number of SKUs that failed in quality check. Click and jump to the [Failded] part in the [Suspended] tab of [Manage Products] page
image.png
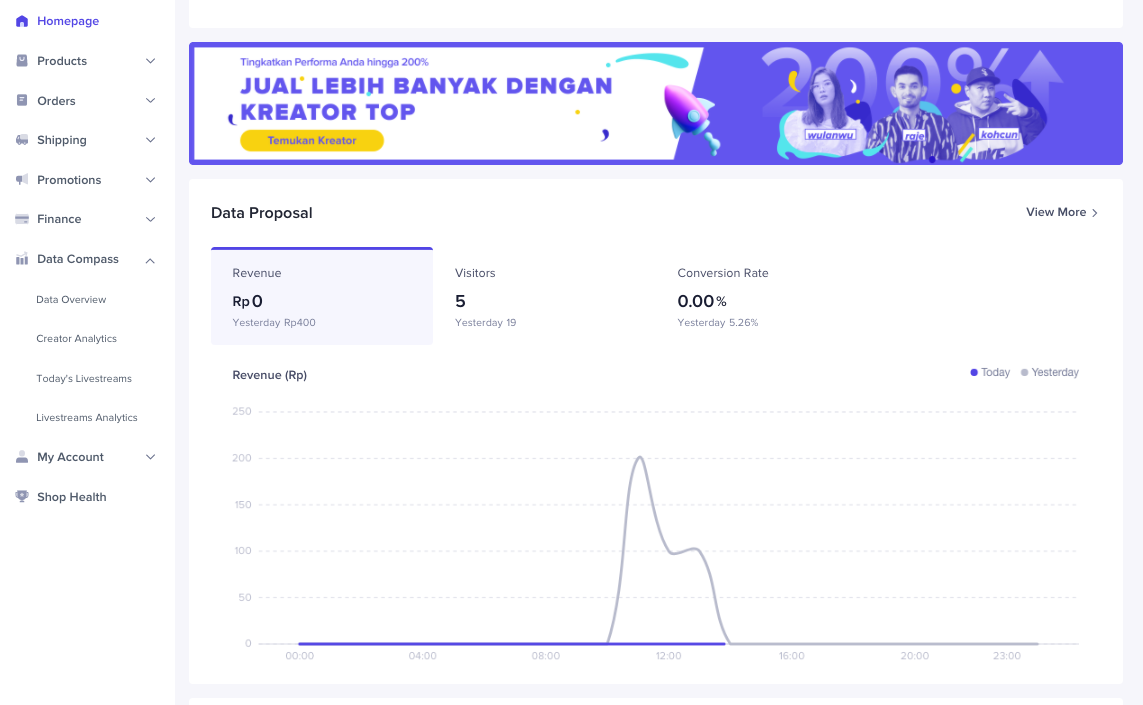
Data Proposal
  • Revenue
    • Total value of daily orders (local currency)
    • Chart:Based on the seller's time zone. It is displayed in the hour dimension. Optionally display only today, yesterday, or today and yesterday.
    • Calculate hourly based on payment order. Do not exclude return, cancellation, and abnormal orders. Orders will be added after payment. COD orders are counted as they are initiated.
  • Visitors
    • Number of visitors to the product details page
    • Chart: Calculate the UV of product SKU. Based on the seller's time zone. It is displayed in the hour dimension. Opetionally display only today, yesterday, or today and yesterday.
  • Conversion rate
    • Number of buyers placing orders on the day/daily total uv
    • Chart: Calculate according to the UV of the number of de-duplicated visitors who pay for the order and the number of SKUs paid for the product. Based on the seller's time zone. It is displayed in the hour dimension. Opetionally display only today, yesterday, or today and yesterday.
  • Click “View More” and enter compass data overview page
image.png
Store Performance
  • Ship-on-time rate
    • Number of orders shipped on time divided by total order number over the past week
    • Calculate based on sub-orders
    • Parcels finishing TTS scanning within 5 natural days are considered shipped on time
    • If buyers cancel order, the result will not be affected. If the seller cancels the order, the denominator will be reduced by 1
    • Standard: platform criterion value 90%
  • Seller cancellation rate
    • Cancellations of orders caused by sellers in the past week(cancellation of one sub-order is counted as one order cancellation; cancellation of multiple sub-orders is also counted as one order cancellation)
    • Calculate based on sub-orders
    • Standard: platform criterion value 5%
  • Return rate
    • Return and refund caused by sellers (exclude refund only) over the past 4 weeks. Only one return will be calculated if multiple sub-orders are returned
    • Calculate based on sub-orders
    • Standard: platform criterion value 5%
image.png

2 Data Compass

  1. Data Overview

Module
Function
Schematic diagram
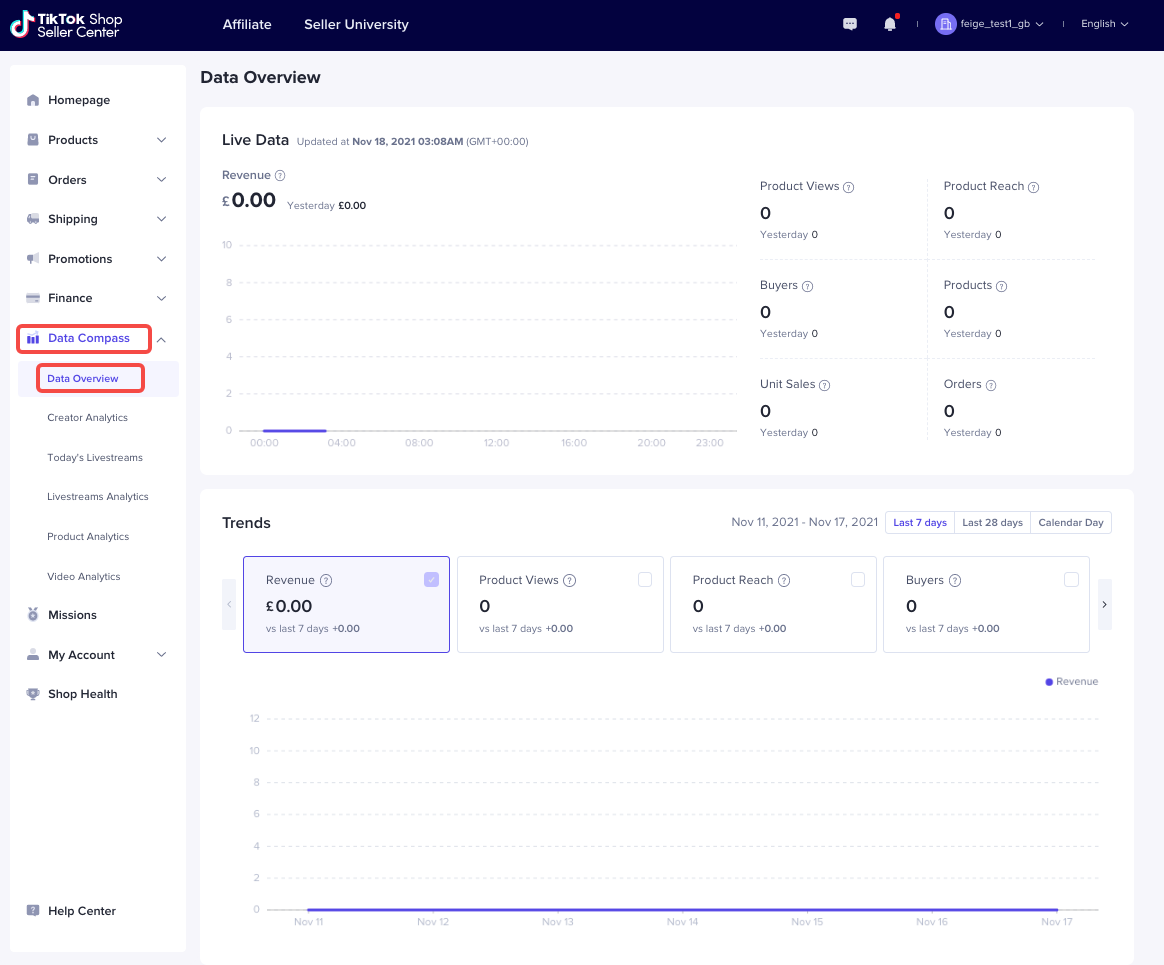
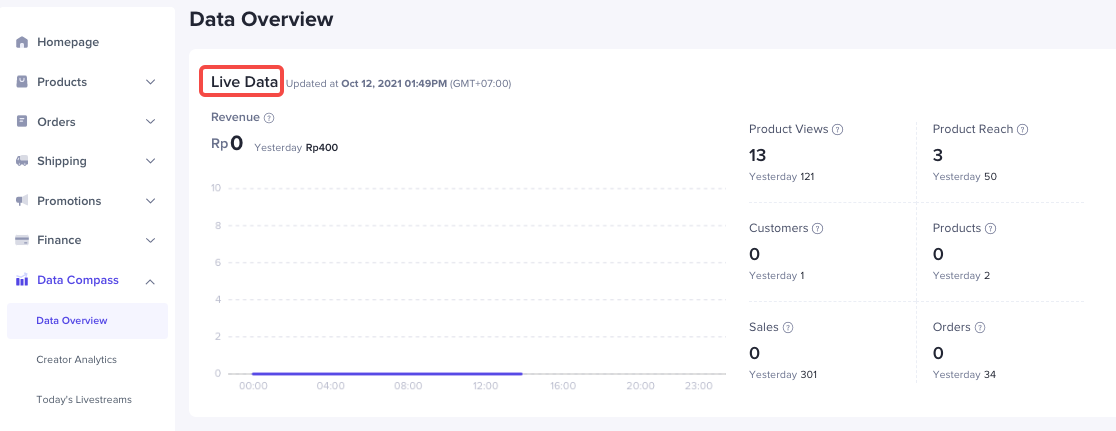
Live Data
  • Indicators:
    • Revenue:User payment through all channels today, including refund orders
    • Product views:the number of product exposure in short videos, livestreams, and showcases of the day
    • Product reach:the number of times that the commodities are clicked in short videos, livestreams, and showcases of the day
    • Customers:the number of users placing orders on all channels today
    • Products:the number of SPU products sold today
    • Sales:the number of goods sold today
    • Orders:the number of SKU orders on all channels today
  • Comparison: Compared to yesterday's data
  • The chart shows real-time transaction amount: there will be one data point per day showing the accumulative transaction amount in the last hour
image.png
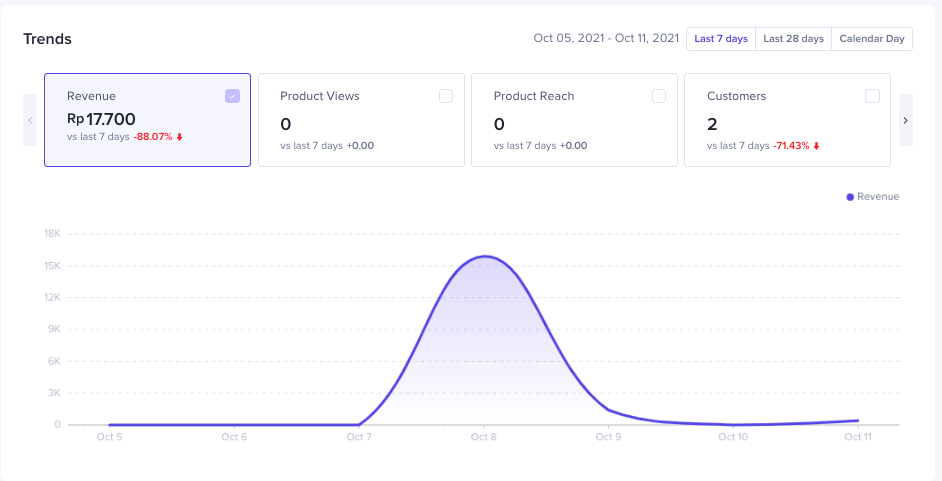
Trends
  • Indicators:
    • Revenue:User payment through all channels today over a certain period of time
    • Product views:the number of product exposure in short videos, livestreams, and showcases over a certain period of time
    • Product reach:the number of times that the commodities are clicked on in short videos, livestreams, and showcases for a certain period of time
    • Customers:the number of users placing orders on all channels for a certain period of time
    • Products:the number of SPU products sold for a certain period of time
    • Sales:the number of goods sold over a certain period of time
    • Orders:the number of SKU orders on all channels over a certain period of time
    • Refund: the refund amount of all products over a certain period of time
    • Conversion Rate: the number of users who successfully placed orders / the number of users who visited the product detail page(visitors) during the time period
    • Visitors: the total number of unique users who visited the merchant’s products detail page during the time period
  • Comparison:
    • Last 7 days: compare performance in a certain period with statistics in the last 7 days and display the increase or decrease percentage
    • Last 28 days: compare performance in a certain period with statistics in the last 28 days and display the increase or decrease percentage
    • Natural days: compare performance in a certain day with statistics of the last day and display the increase or decrease percentage
  • Chart:
    • Display the trend of certain indicators. A maximum of 2 indicators can be selected at the same time
    • You can use hover to view the specific dara
    • You can select any day within 7/28/90 days of today
image.png

b. Creator Analytics

Module
Function
Schematic diagram
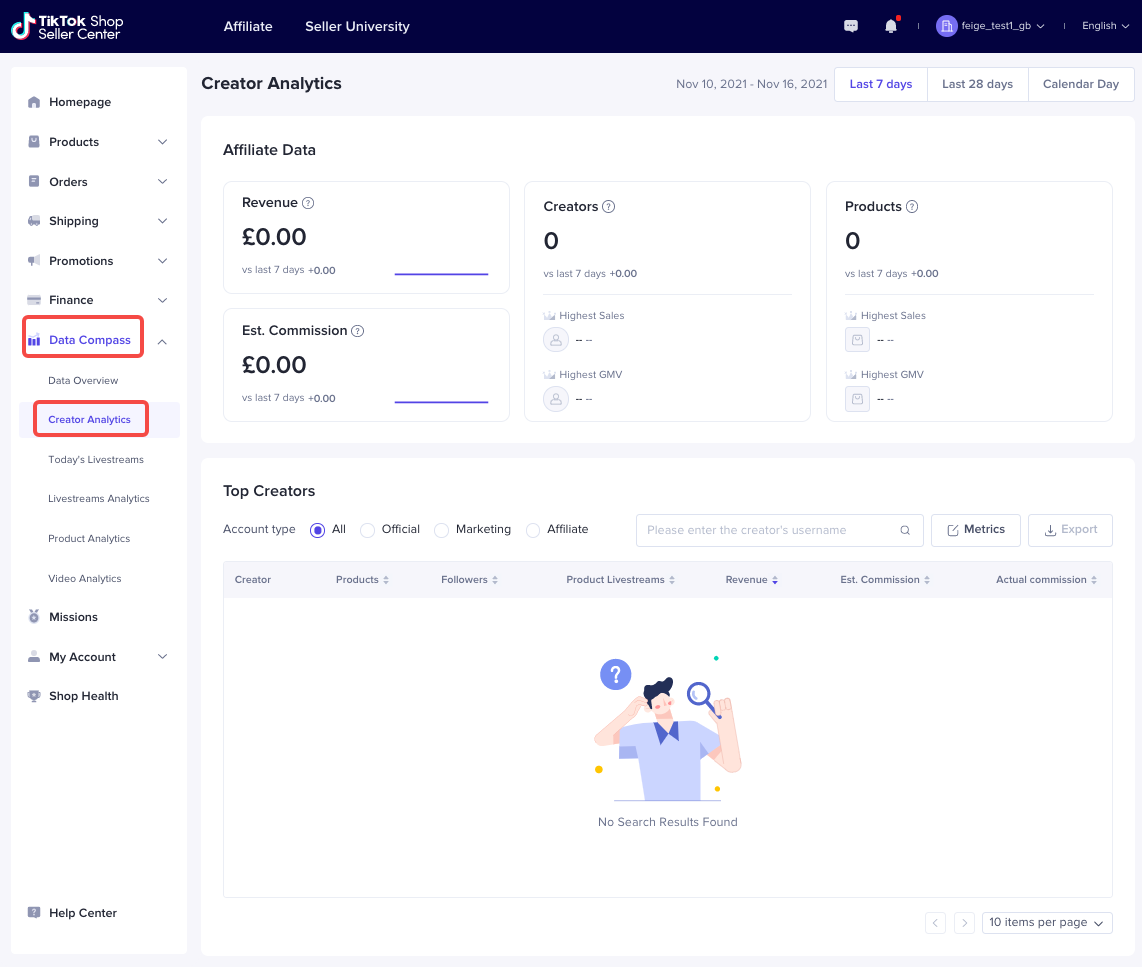
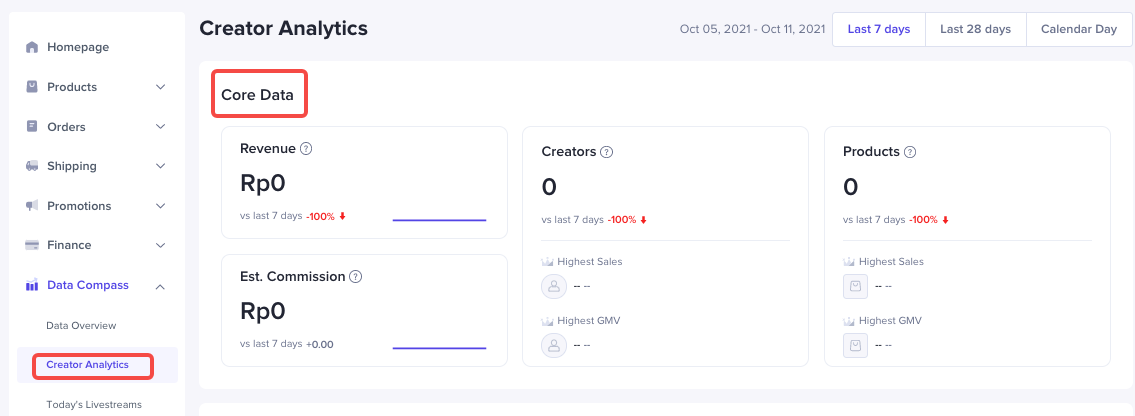
Affiliate Data
  • Filter:
    • You can select any day within 7/28 days of today or one day in the past 90 days
  • Indicators:
    • Revenue:the transaction amount of orders placed through affiliates over a certain period, including reverse orders like return and refund
    • Creators:the number of creators with sales over a certain period
    • Products:The number of SPU products sold through affiliates over a certain period
    • Est. Comission:the commission that is estimated to be paid to creators with sales over a certain period
    • Highest sales creator:creator with the highest sales
    • Highest GMV creator:creators with the highest GMV
    • Highest sales product:the number of goods with the highest number of transactions
    • Highest GMV product:the product that contributed the most to GMV
  • Comparison:
    • Last 7 days: compare performance in a certain period with statistics in the last 7 days and display the increase or decrease percentage
    • Last 28 days: compare performance in a certain period with statistics in the last 28 days and display the increase or decrease percentage
    • Natural days: compare performance in a certain day with statistics of the last day and display the increase or decrease percentage
image.png
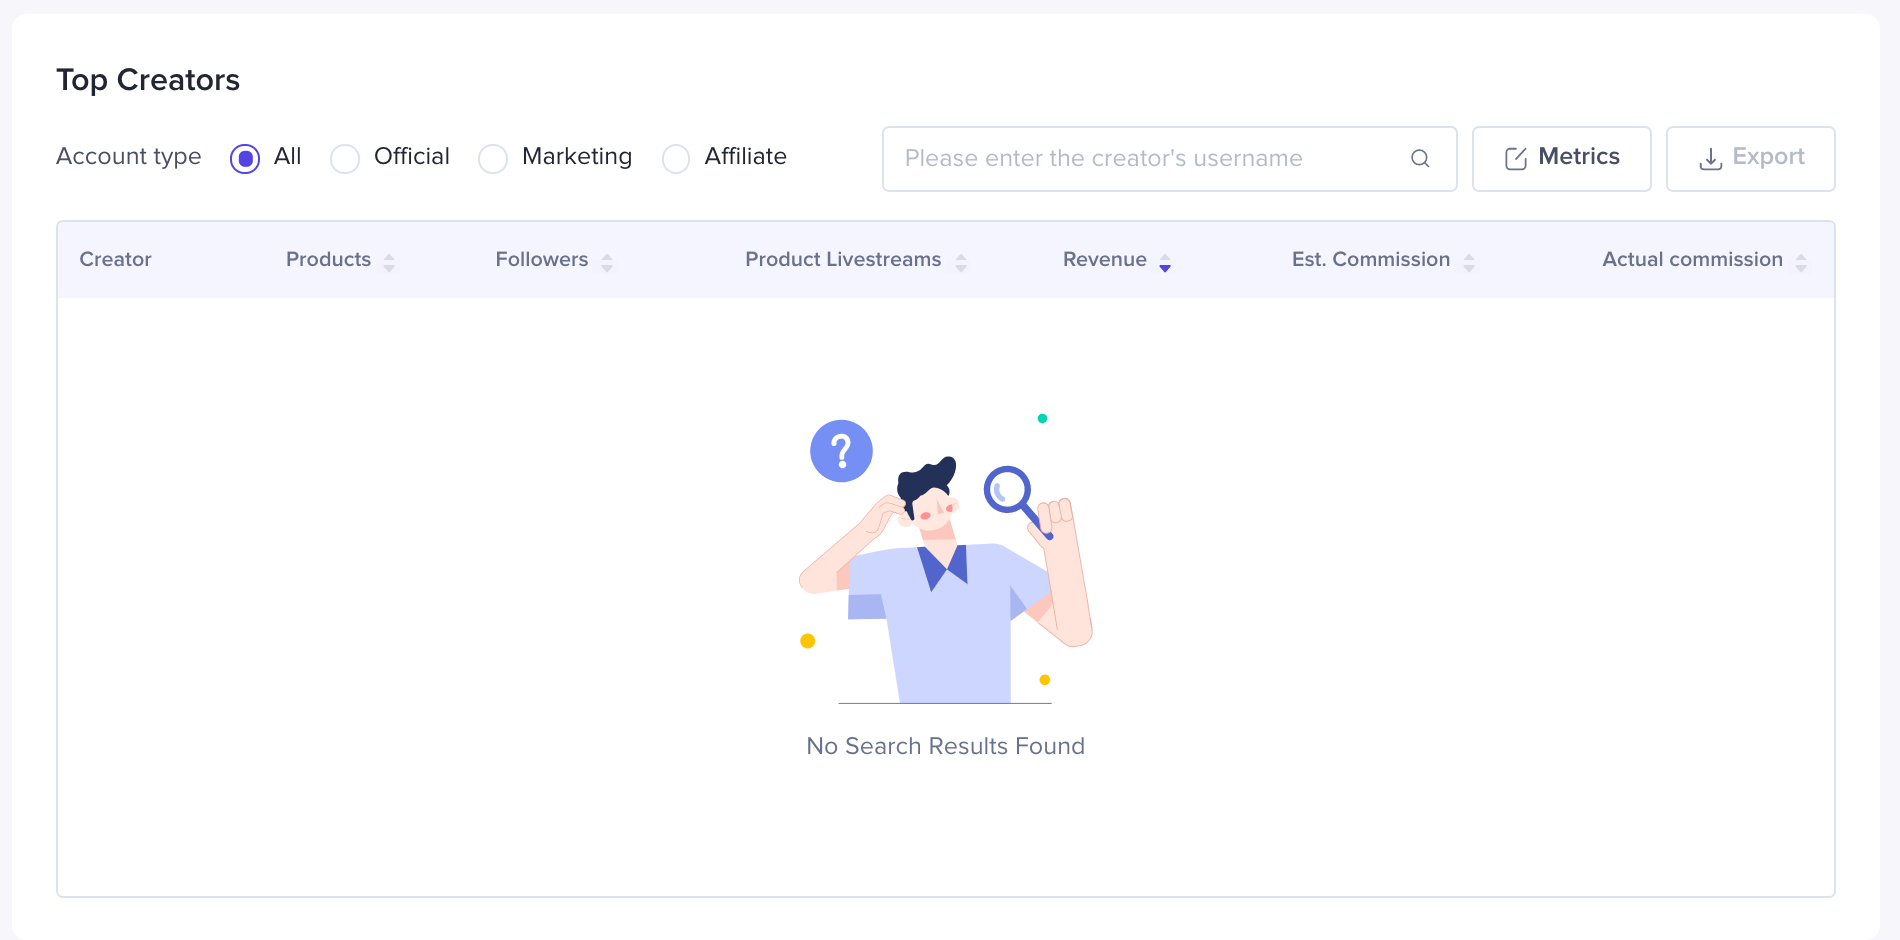
Top Creators
  • Filter:
    • You can search affiliate creators who have cooperated with you via the creator handle search engine
    • You can restrict creators search by channels:
      • All
      • Official
      • Marketing
      • Affiliate
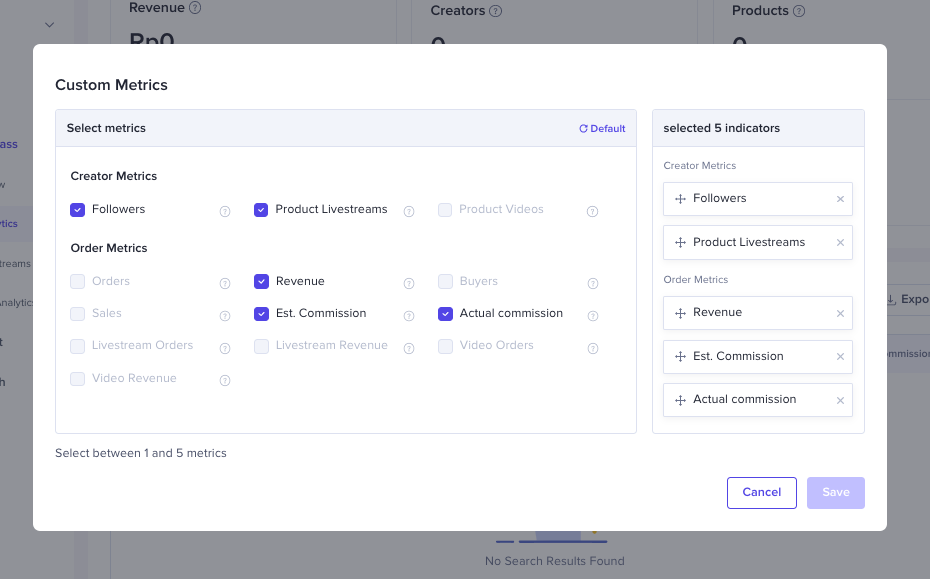
  • Configuration indicators:
    • Select a maximum of five and a minimum of one indicator
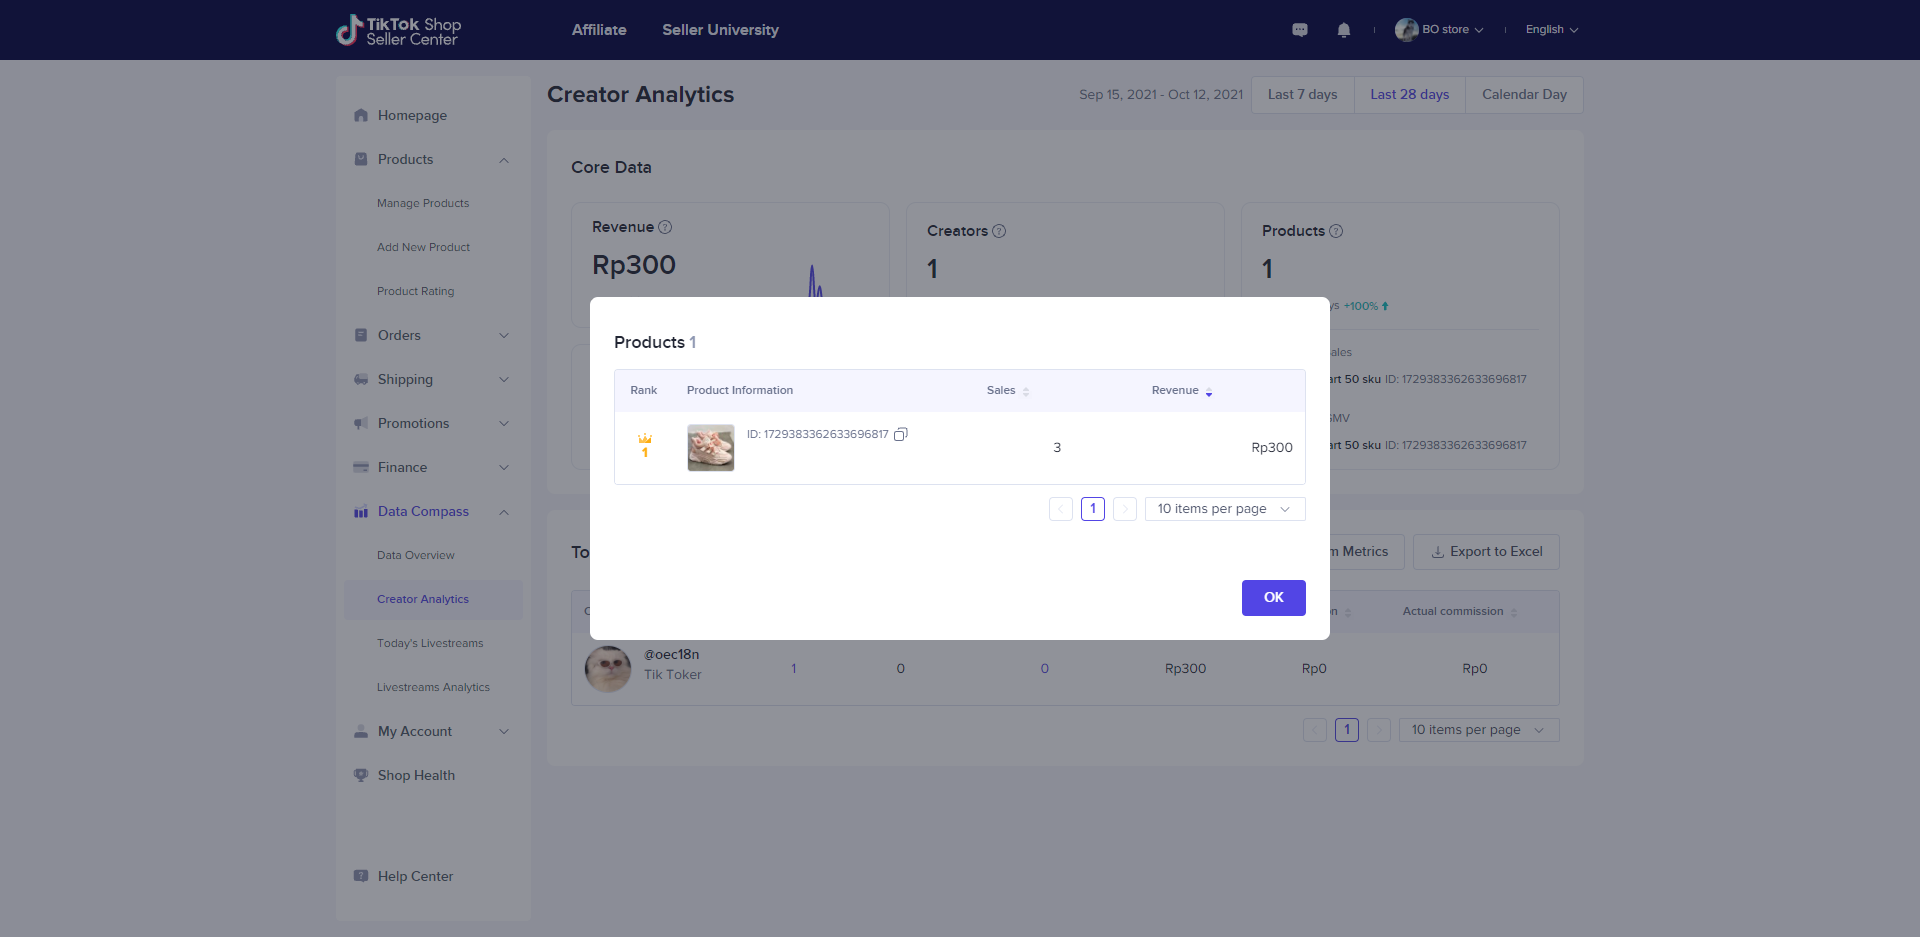
    • Fixed display of basic information of creators and the number of traded products. Click the number of traded goods to see the floating layer displaying product information
    • You can drag and drop indicators to change the display order
    • Creator indicators:
      • Followers:the number of followers the creator has on TT
      • Product Livestreams:the number of Livestreams in which creators promote products for sellers. This means that products are listed in live rooms, and you can click this button to see the floating layer displaying Livestream information
      • Product Videos: the number of creators' short videos to help sellers promote products. This means that sellers' shopping carts are attached to short videos and you can click this button to see the floating layer displaying short video information
    • Transaction indicators:
      • Orders: number of SKU orders successfully promoted by creators over a certain period
      • Revenue: the total value of products successfully promoted by creators in a certain period
      • Buyers: the total number of users buying products promoted by creators in a certain period
      • Unit Sales: the number of product units sold via the creator within the selected period
      • Est. Commission: the estimated commission paid to creators in a certain period
      • Actual comission: the actual commission paid to creators in a certain period
      • Livestream Orders: the number of SKU orders successfully promoted by creators via Livestreams in a certain period
      • Livestream Revenue: the total value of orders successfully promoted by creators via Livestreams in a certain period
      • Video Orders: the number of SKU orders successfully promoted by creators via short videos over a certain period
      • Video Revenue: the total value of orders successfully promoted by creators via short videos
  • Indicator display:
    • Sorted based on transaction amount from the highest to the lowest;
    • Apart from indicators of creators, all the other indicators can be sorted;
  • Export data:
    • Click the download button to download the creators' statistics containing all of the fields
image.pngimage.png
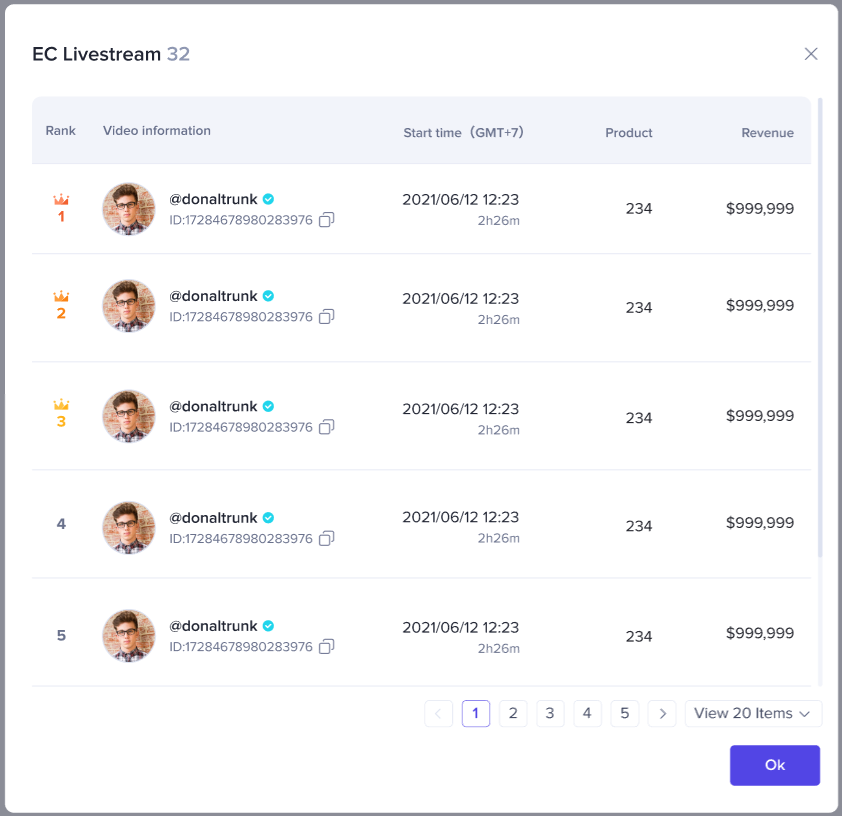
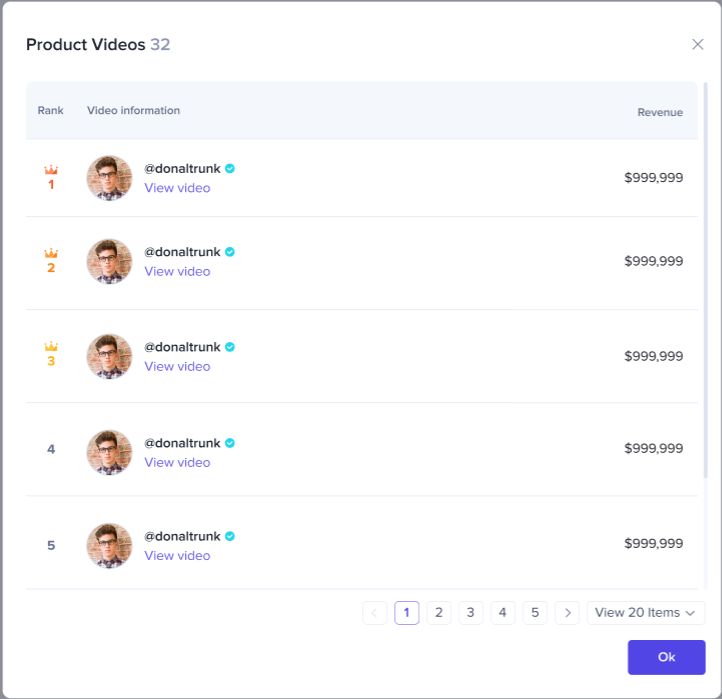
Floating pop-up window
  • transactions:
    • It presents the information of the products (including key image, title, ID) promoted by creators, number of transactions and sales value during a certain period.
    • ranked by revenue in default. It can also be ranked by the number of transactions.
  • number of LIVE sessions:
It presents the information of the LIVE room of that creator (including creator's name, LIVE room ID) , time (LIVE starting time, duration), transaction numbers and transaction value during a certain period.
  • ranked by revenue in default. It can also be ranked by the number of transactions.
  • submitted e-commerce videos:
    • It shows the short video information of the creator's product promotion (profile picture of the creator, creator handle, short video link) and the transaction value in a certain period.
    • ranked by revenue in default
image.pngimage.pngimage.png

c. Today's Livestreams

Module
Function
Schematic diagram
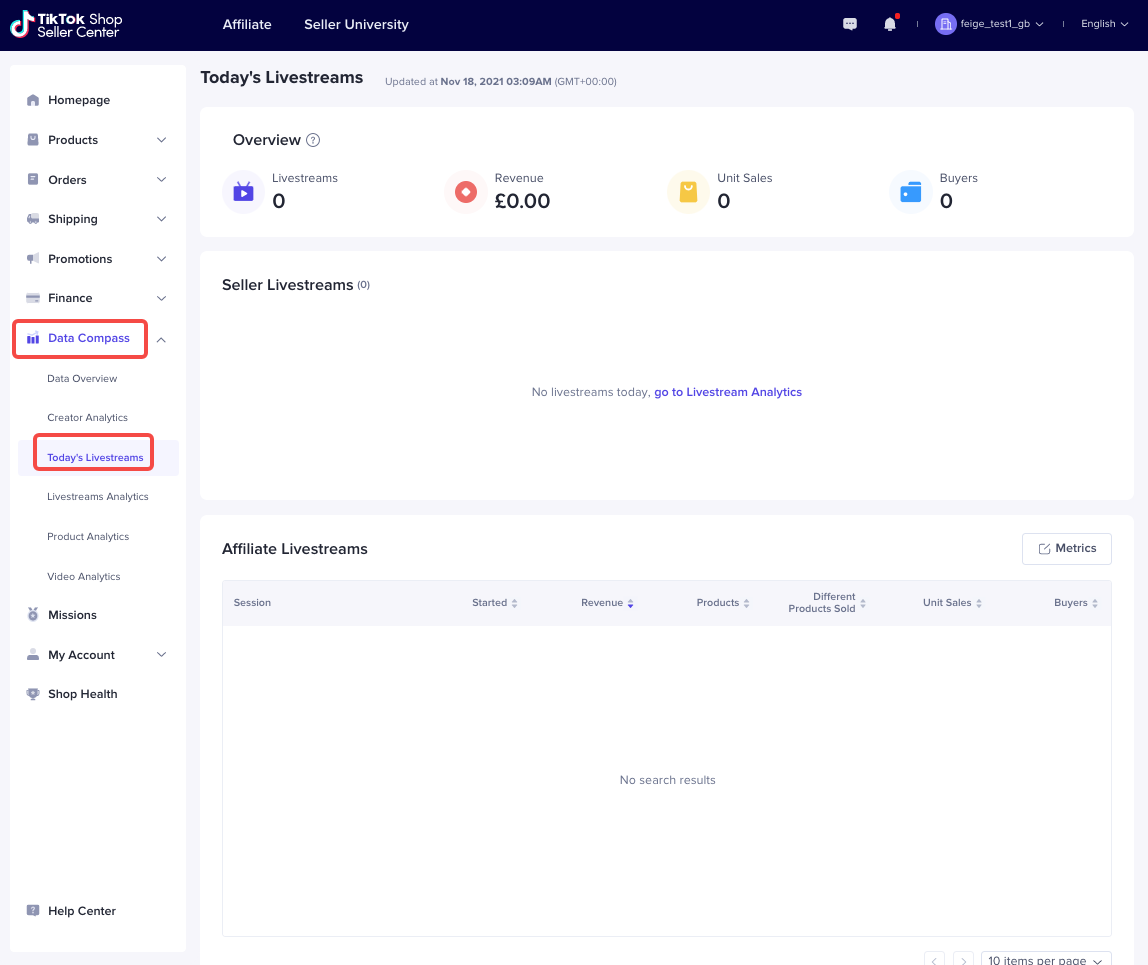
Overview
  • real-time data update
  • LIVE data including self-operating LIVEs on that day+creator LIVEs
  • Indicators:
    • Livestreams:the number of LIVE sessions of the seller on that day
    • Revenue: the total transaction value of the seller generated through LIVEs
    • Unit Sales: the number of items sold through LIVEs on that day for the seller.
    • Buyers:the de-duplicated amount of buyers for the seller's products on that day.
image.png
Seller Livestreams
  • LIVE dashboard:information of each seller self-promotion LIVE will be presented
    • sequence: according to the time of LIVE. The latest LIVE will be shown first.
    • basic information of the LIVE: Creator's profile picture, creator's name, creator handle, started time, duration.
    • LIVE status: If the LIVE is ongoing, it will be signified on the creator's profile picture.
    • Big screen button: click to enter the big screen to see detailed statistics of the LIVE.
  • Indicators:
    • Revenue: the transaction value generated so far in that LIVE, not excluding refund, returned orders or other reverse orders.
    • ACU:Average viewer amount every minute
    • Average price: transaction value/the number of sold items in that LIVE
image.png
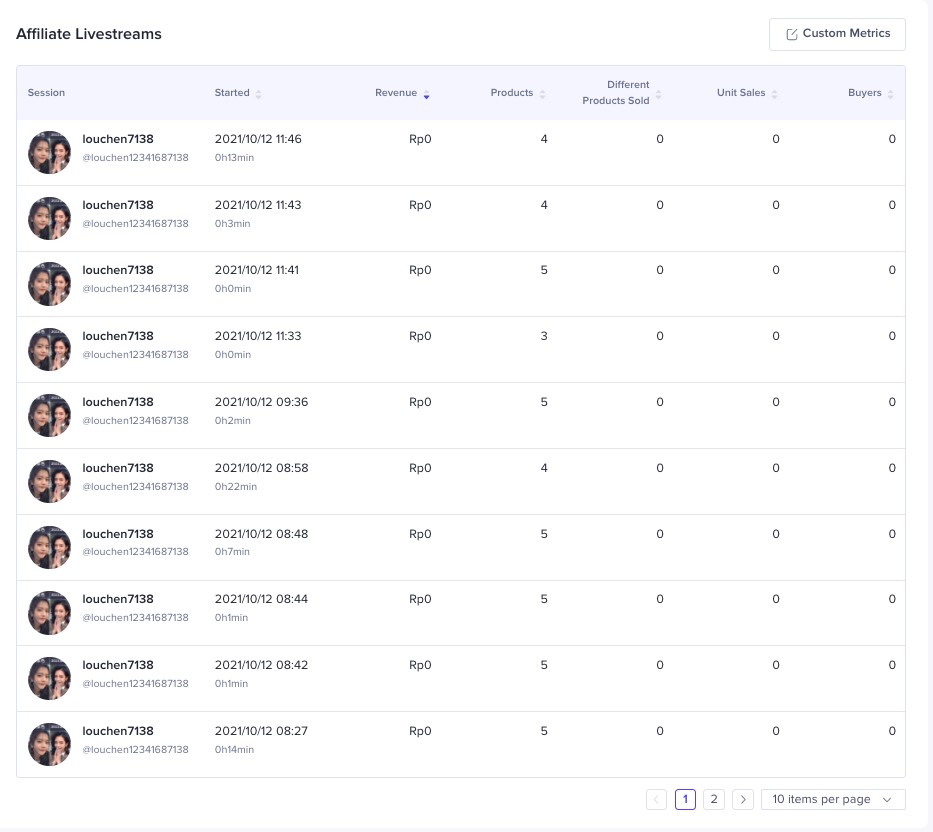
Affiliate Livestreams
  • Indicator customization:
    • LIVE session information and started time are fixed. Those two are not removable. You can customize the other indicators.
    • To reconfigure, you need to select 5 indicators at maximum and 1 at minimum.
    • Drag and drop the indicators to change the display order.
    • transaction indicators:
      • Revenue:the accumulated amount of payment during the LIVE, including returned orders and refund.
      • Products:accumulated amount of products promoted in the LIVE
      • Different Products Sold:The number of products with sales in the LIVE
      • Unit Sales:accumulated units that have been sold in the LIVE
      • Buyers:The de-duplicated number of users that have issued payment in LIVE, including refund.
      • Unit Price:transaction value/the number of units sold
    • Traffic indicators:
      • product exposure:the times of exposure of the products in LIVE, including exposing the product list and the product listing card.
      • clicks:the number of clicks of the product in LIVE, including product list and the product listing card.
      • viewers:accumulated viewers in the LIVE
      • average online viewers:the average number of viewers online every minute in this LIVE
  • Indicator display:
    • For mixed LIVE, only the information of products from this seller will be shown
    • sorted by time, from the latest by default
    • Except for the LIVE session column, the other indicators can all be re-ordered
  • No big screen for Affiliate creators' LIVE sessions
image.png
Live Dashboard
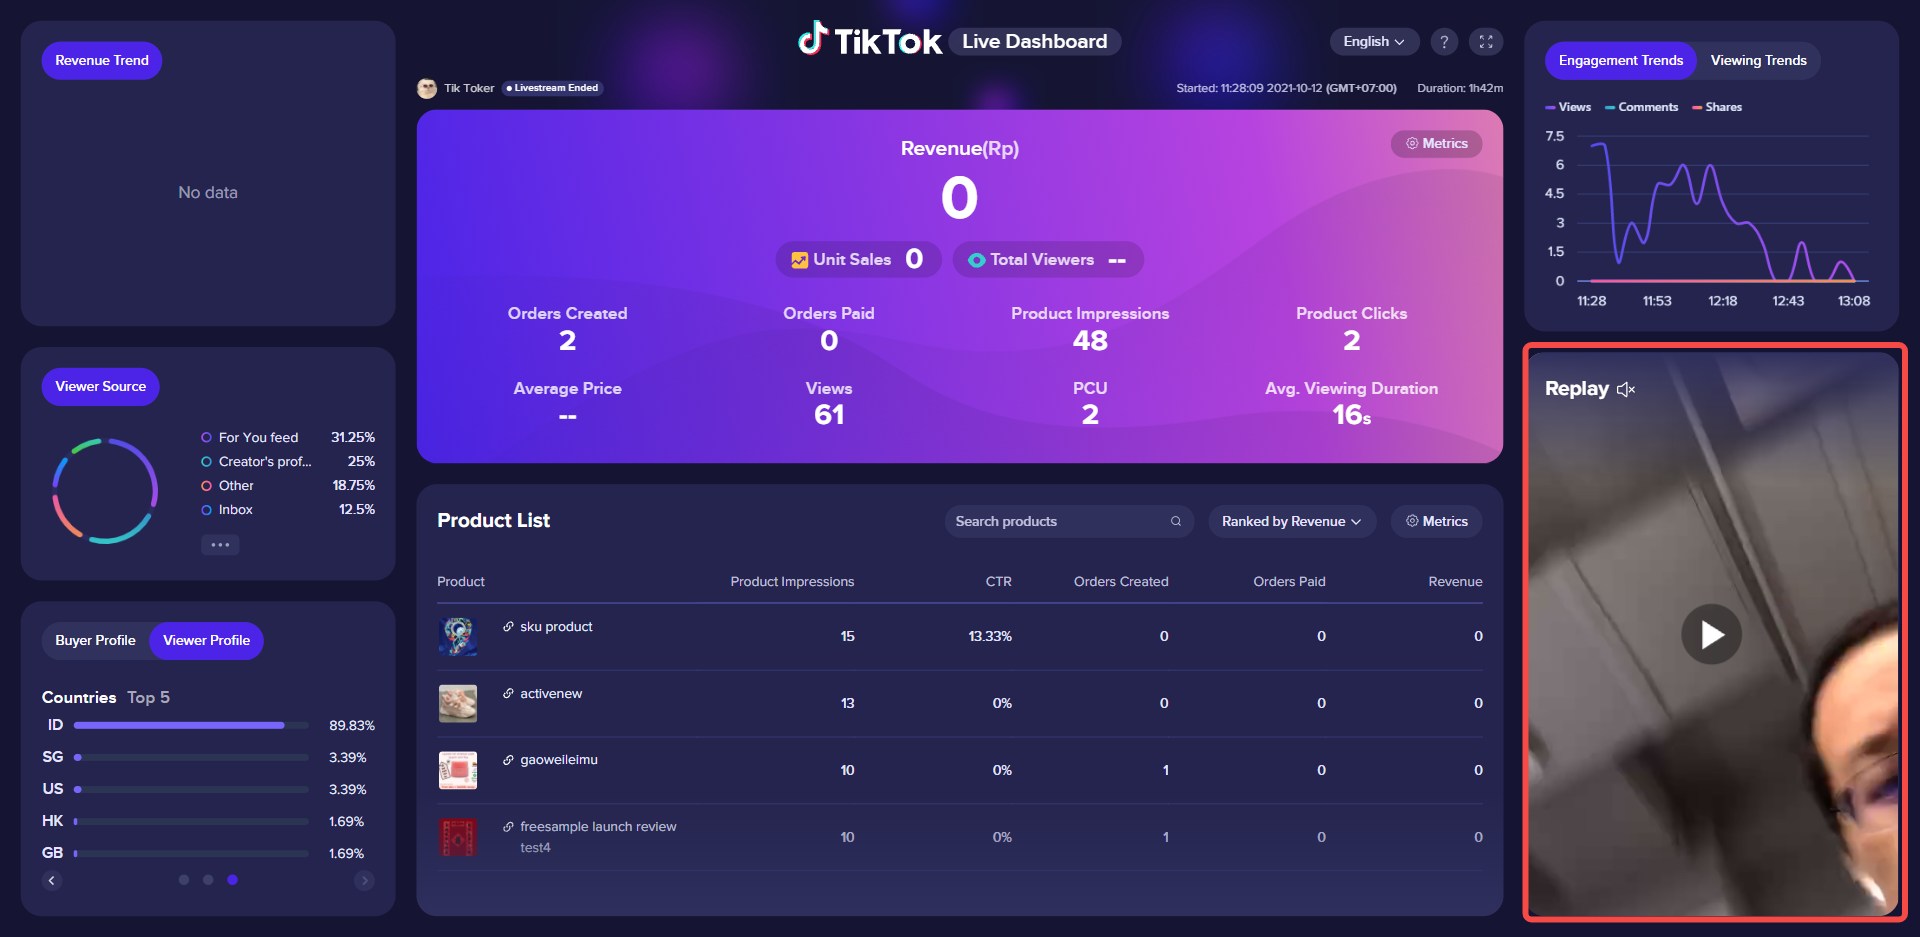
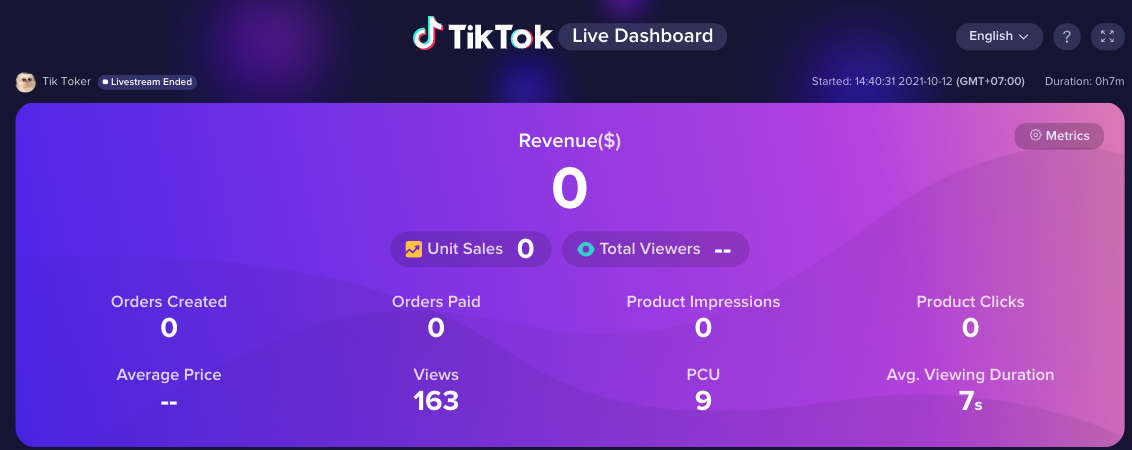
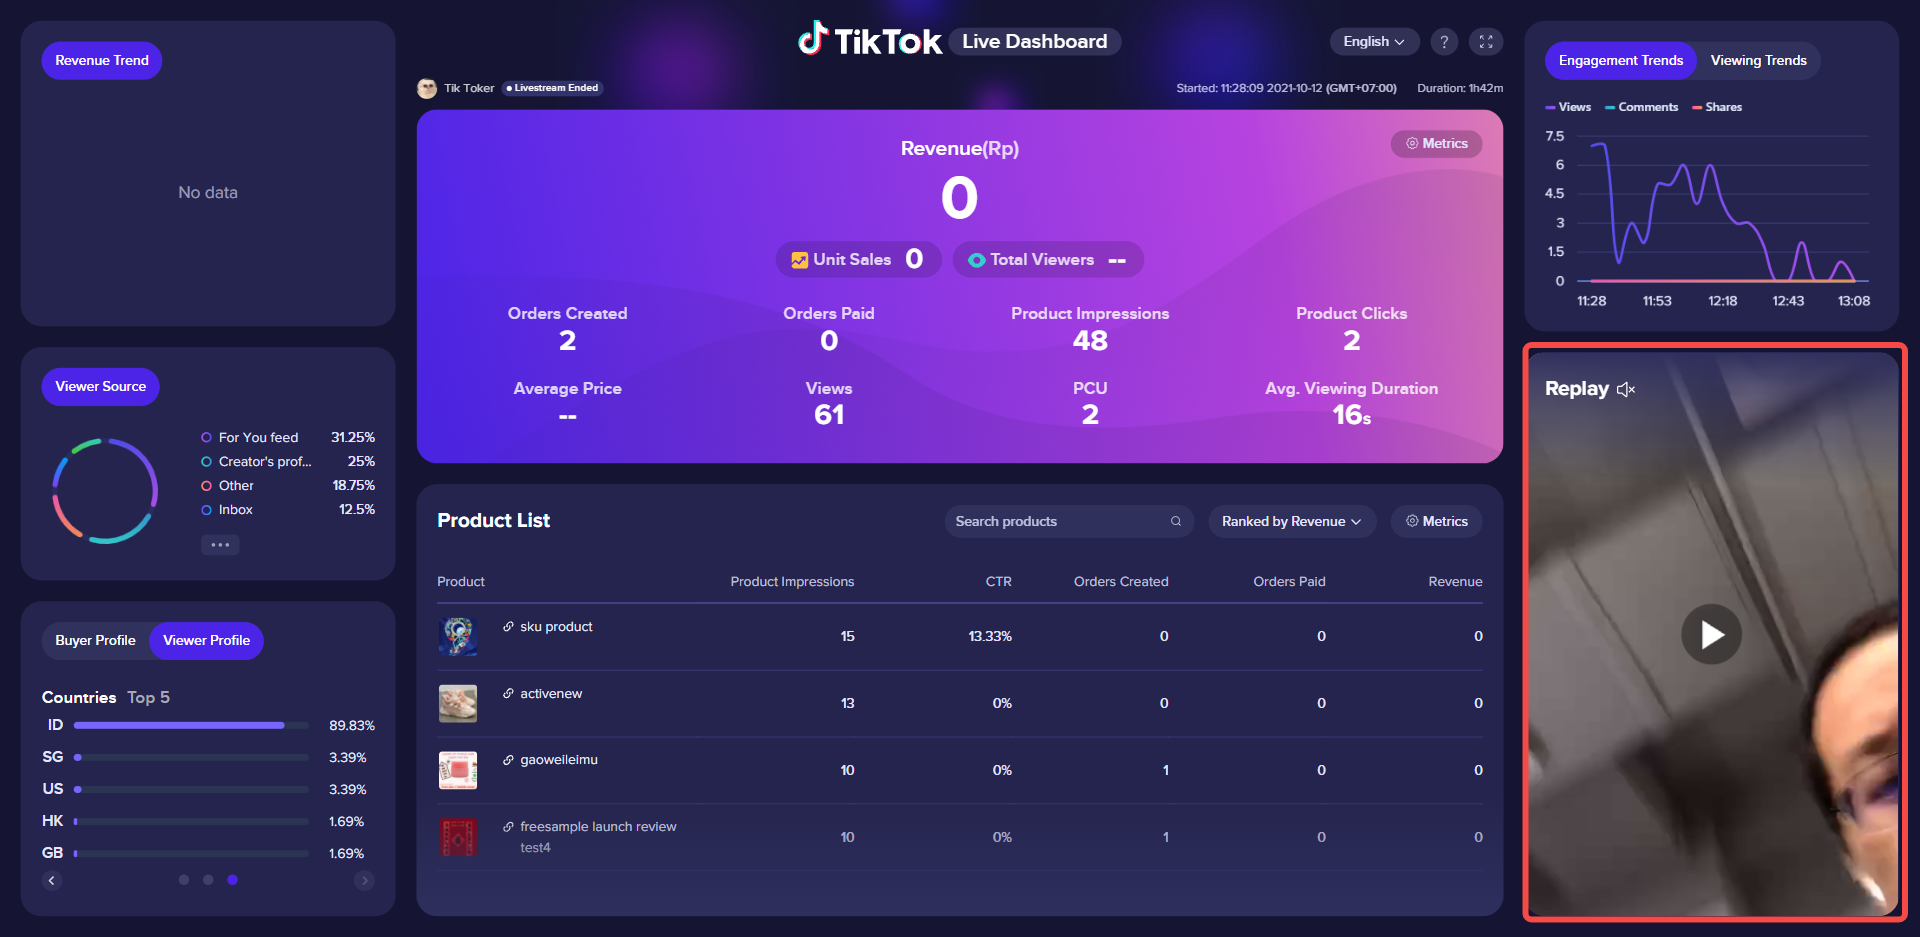
Core Data Display
  1. orders created
  2. orders paid
  3. product impressions
  4. product clicks
  5. average price
  6. page views
  7. PCU: viewers online at peak time
  8. average viewing duration
  1. Please refer to each module for the refreshing time
  2. Data backtracking: the latest 3 months.
  3. Language: switch to a different language.
  4. Time zone: the time of the creator's operation location, the same as data compass
  5. Currency unit: local currency
  6. Help: click on the help icon “?” on the top right of the screen to access the introduction document.
  7. Scope of statistics: The dashboard only shows the transaction and conversion data of the products which belong to the seller. The LIVE traffic data shows the traffic of the entire LIVE session.
  8. LIVE room data: refreshing automatically every 3 seconds until five minutes after the LIVE ends.
    1. Creator's name
    2. Started time: the time when the LIVE actually starts (in the creator's time zone)
    3. Duration: duration of this LIVE
    4. Time Zone: the time of the creator's operation location
  9. Core data
    1. transaction value in LIVE
    2. the number of units sold in LIVE
    3. the number of viewers: accumulated number of viewers will be shown when the LIVE ends.
    4. LIVE data: the indicators can be reconfigured manually by selecting the indicators you want to show, 1 at minimum and 8 at maximum.
      1. configuration indicators
        1. buyers
        2. payment success rate
        3. accumulated comments
        4. accumulated shares
        5. accumulated increased followers
image.pngimage.png
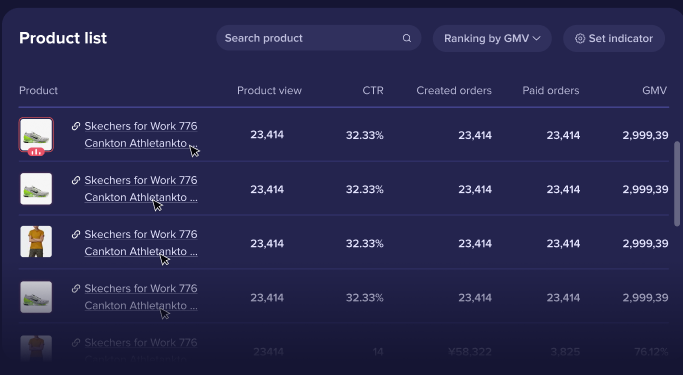
Product List Product List: refreshing automatically every 3 seconds until five minutes after the LIVE ends.
  • Products on LIVE: The products being introduced will be placed on the top of the list (not influenced by other sorting rules). Products that are currently being introduced will be marked by a "halo lights" visual effect
  • Product list, showing all the products that have been listed in the this LIVE
    • Support upward or downward sorting, based on transaction value by default.
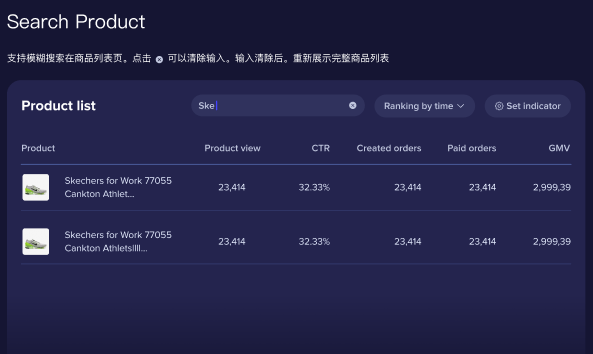
    • Support product search. You may search by the product's name (inaccurate), and find the information in search results.
      • support inaccurate search on the product list page.
      • The indicator setting is the same as that in the complete product list, selecting 5 at maximum and 1 at minimum. The last selected cannot be removed.
      • The search result will be shown according to your indicator setting.
    • product information
      • Product name. Click to enter the product details page.
      • Product image
    • Product indicators: The displayed indicators can be customized. Five indicators are shown by default; you can select to display 5 at maximum and 1 at minimum.
      • default indicators:
        • Product view-pv
        • Click through rate / CTR
        • Created orders
        • Paid orders
        • GMV
      • Other indicators to choose:
        • Unit price
        • Product click-pv
        • Users with order
        • Paid users
        • Remaining stocks
        • Sold units
        • Payment success rate
  • Product list reminder
    • We cannot access other sellers' products. If the products in the LIVE are from another seller, a reminder will be shown.
image.pngimage.png
Revenue Trend
  • Revenue trend (The data is automatically refreshed every minute until 5 minutes after the LIVE ends.)
    • LIVE revenue: showing the trend by each minute. If the data of the latest 2min is not displayed due to latency, it will be skipped.
    • Data details:
      • Started less than or equal to 1 hour: every minute of data can be hovered to check details
      • Started over 1 hour and less than or equal to 5 hours: a data point of every 5 minutes can be hovered to check details
      • Started over 5 hours: a data point of every 15 minutes can be hovered to check details
 
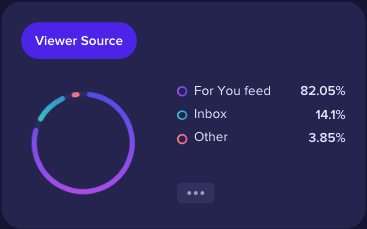
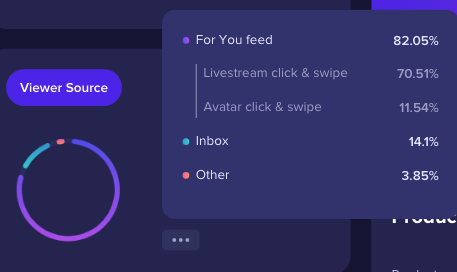
Viewer Source Traffic source&order source(The data is refreshed automatically every 1 minute until 5 minutes after the LIVE ends)
  • LIVE viewer source :
    • Break down the LIVE pv to see the number of viewers from different channels.
image.pngimage.png
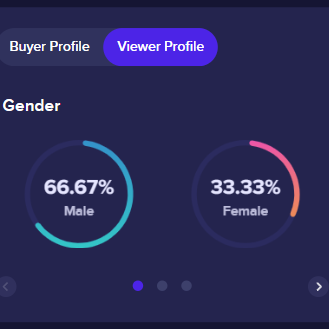
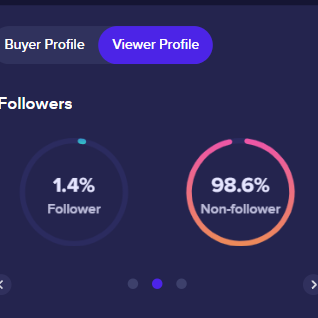
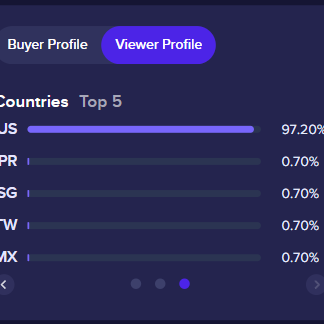
Buyer Profile&Viewer Profile User Profile (The data is refreshed automatically every 1 minute until 5 minutes after the LIVE ends) Location data that cannot be recorded are not included.
  • Buyer profile:
    • Gender:gender distribution of accumulated buyers in the LIVE
    • Follower:follower/non-follower
  • Viewer profile:
    • Gender:gender distribution of accumulated viewers in the LIVE
    • Follower:follower/non-follower
    • Countries: the countries of viewers. Only the top five countries are shown.
image.pngimage.pngimage.png
Engagement Trends & Viewing Trands
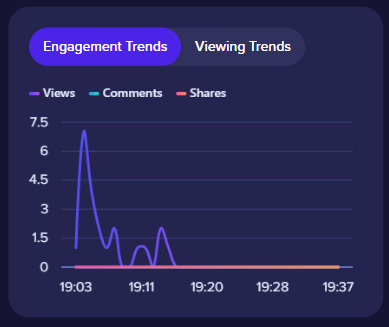
  • Engagement Trends (Update the data every minute and stop 5 minutes after the LIVE is over)
    • LIVE PV: Update pv every minute
    • Number of Comments: Minute-level comment data (trending graph)
    • Number of Shares: Minute-level share data (trending graph)
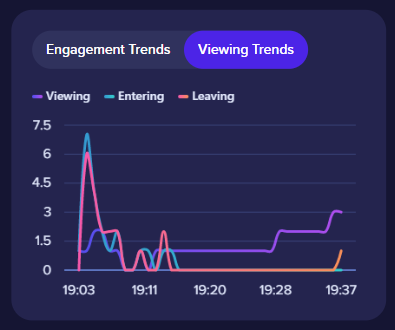
  • Popularity Trends (Update the data every minute and stop 5 minutes after the LIVE is over)
    • Real-time Online Viewers: The number of real-time online viewers in the LIVE (uv)
    • People Entering LIVE: The number of people entering the LIVE in real time
    • People Leaving LIVE: The number of people leaving the LIVE in real time
  • Data Specifics:
    • LIVE ≤ 1 hour: You can hover over the graph to see the data specifics at the one-minute level
    • 1 hour < LIVE < 5 hours: You can hover over the graph to see the data specifics at the 5-minute level
    • LIVE > 5 hours: You can hover over the graph to see the data specifics at the 15-minute level
image.pngimage.png
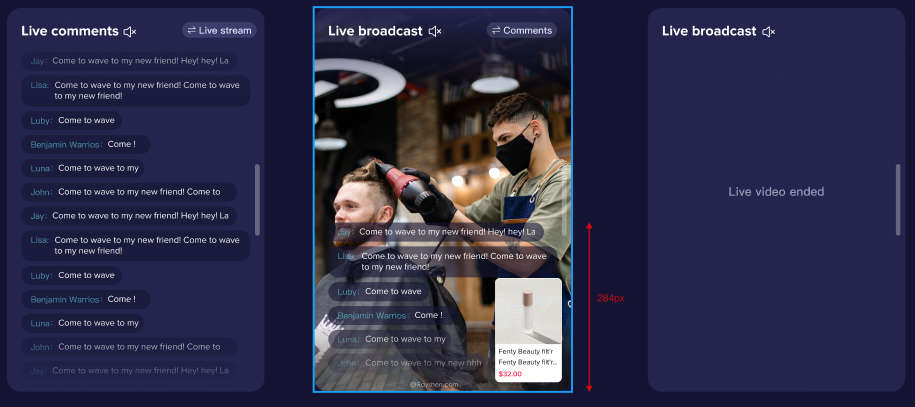
Live Broadcast & Comments
  • LIVE Streams (Update the comments every second and stop 5 minutes after the LIVE is over)
    • Show the real-time LIVE stream
    • Comment: Show the users' comments. Fetch the latest comments every second
    • Product Listing: Show the listing of products being promoted
    • Replay: Enable access to the replay after the LIVE is over
image.pngimage.png

d. Livestreams Analytics

Module
Function
Schematic diagram
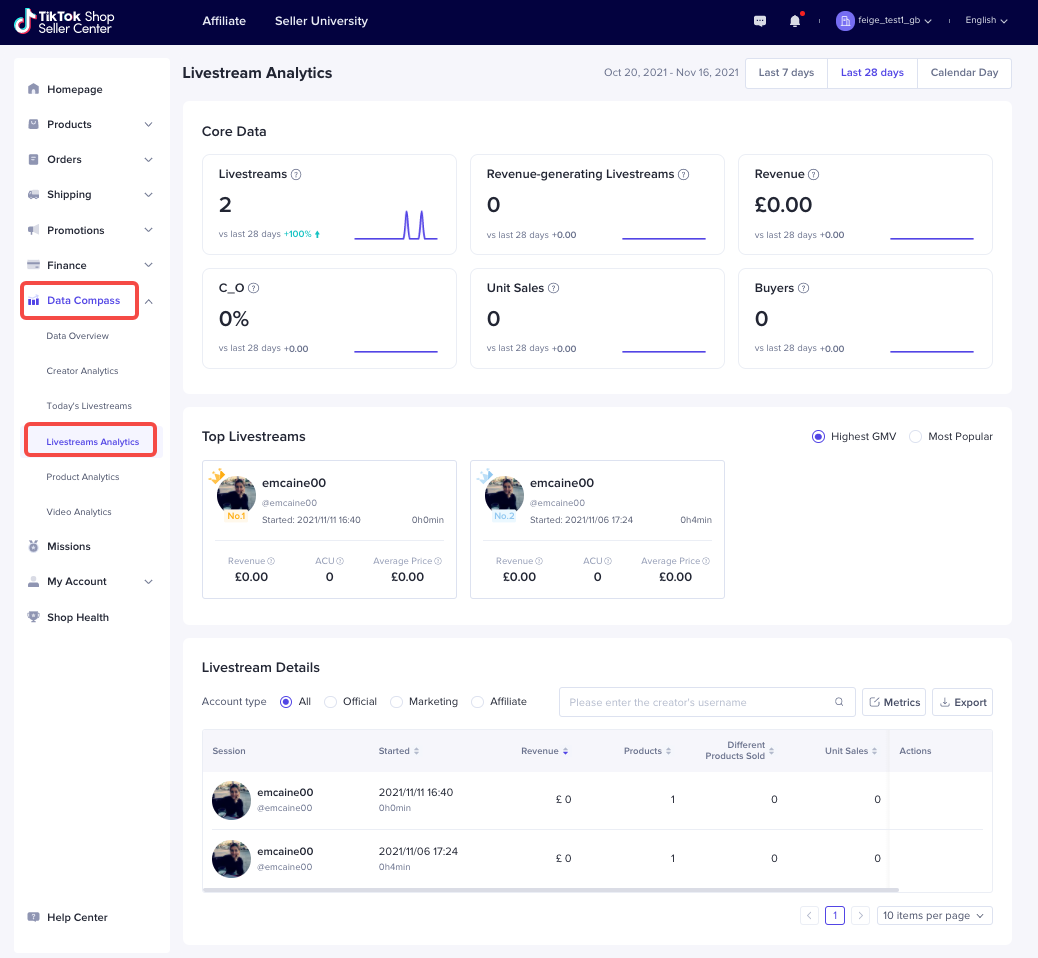
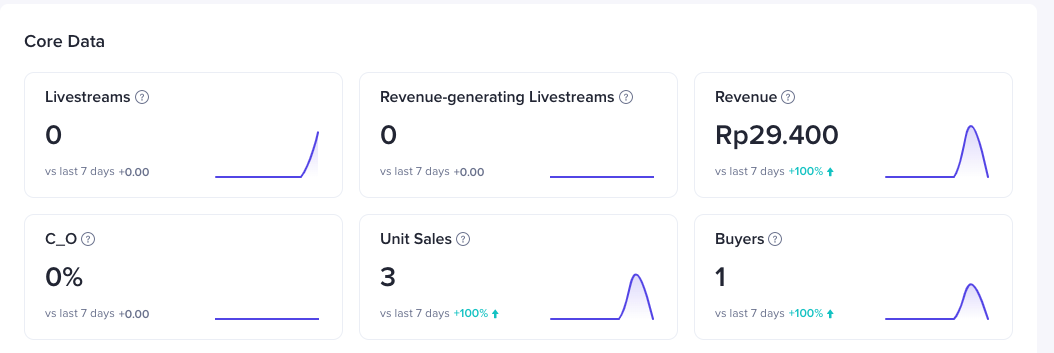
Core Data
  • Filter:
    • You can select any day within 7/28 days of today or one day in the past 90 days
  • Indicators:
    • Livestreams: Number of live broadcast rooms in the selected period
    • Revenue-generating Livestreams: Number of live rooms with transaction amount in the selected period
    • Revenue: The accumulated payment order amount in the live broadcast room during the selected period, not excluding reverse orders such as returns and refunds
    • C_O: Orders / product clicks via livestream channel
    • Uint Sales: The cumulative number of products sold from livestreams
    • Buyers: The number of unique users who paid for orders made from livestreams
  • Data Comparison:
    • Last 7 Days: Show the percentage going up or down over the last 7 days
    • Last 28 Days: Show the percentage going up or down over the last 28 days
    • Natural Day: Show the percentage going up or down over the previous day
image.png
Top Livestreams
They include self-operating LIVEs by sellers and promotion LIVEs by creators. They are shown in the form of LIVE Dashboards separately as per the GMV and popularity
  • TOP-GMV LIVEs
    • Basic Information: Creator's avatar, nickname, handle, and the start time and duration of the LIVE
    • Feature Buttons: LIVE Screen. For ongoing LIVEs, show the ongoing LIVE in full screen. For finished LIVEs, show the replay screen
    • Indicators: GMV, ACU, CPU
  • TOP-Popularity LIVEs
    • Basic Information: Creator's avatar, nickname, handle, and the start time and duration of the LIVE
    • Feature Buttons: LIVE Screen. For ongoing LIVEs, show the ongoing LIVE in full screen. For finished LIVEs, show the replay screen
    • Indicators: GMV, ACU, CPU
image.png
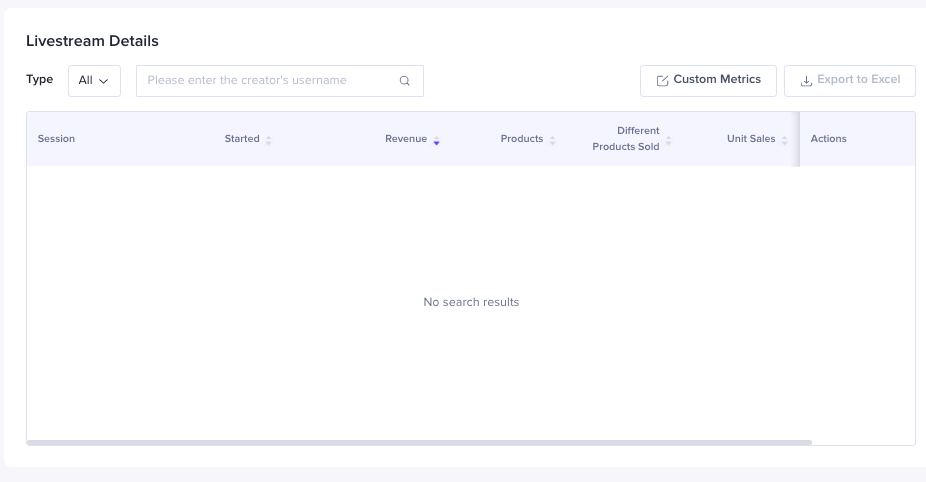
Livestream Details
  • Filter:
    • Filter as per the account types
      • All accounts
      • Official accounts
      • Channel accounts
      • Affiliate accounts
    • Enable fuzzy search as per the creator's handles and show the corresponding LIVEs
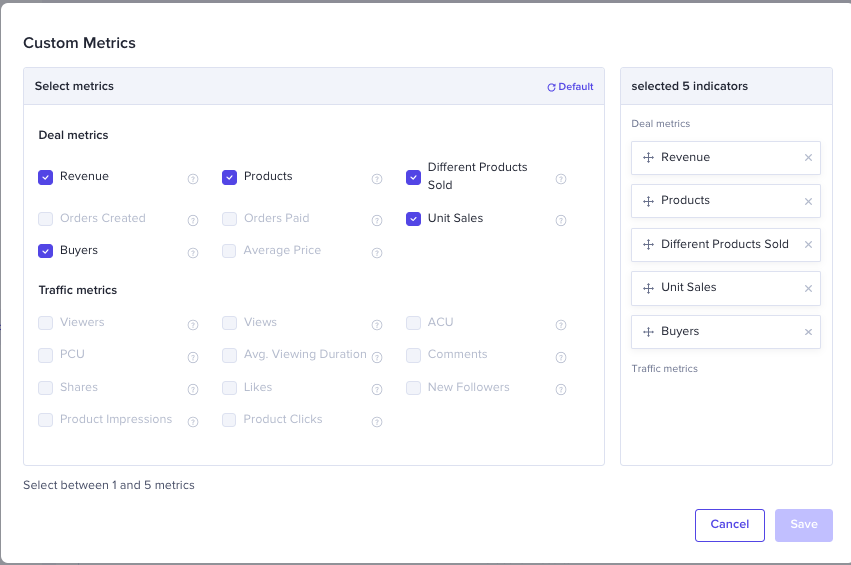
  • Custom Metrics
    • A window will pop up when you click the Custom Metrics button, where you can select or cancel metrics
    • Choose at least 1 but at most 5 metrics
    • You can manually move the metrics to change their order of presentation
    • Put your mouse over "?" and you can see the calculation methods
    • Official accounts & channel accounts:
      • Deal Metrics: Revenue, the number of products put on shelf, products with sales, orders created, orders paid, sold products and buyers, and the average price
      • Traffic Metrics: The number of viewers, views, ACU, PCU, average viewing duration, comments, shares, likes, new followers, product impressions and product clicks
    • Affiliate:
      • Deal Metrics: Revenues, the number of products put on shelf, products with sales, sold products and buyers, and the average price
      • Traffic Metrics: Product impressions, product clicks, views, ACU
  • Data Sheet:
    • Must show LIVE information and the start time. Other metrics can be shown as needed
    • Rank LIVEs as per their start time, from the latest to the earliest
    • Other metrics than LIVE information can be ranked in specific orders
  • Data Export: Click the Data Export Button to export all the data
image.pngimage.png

e. Product Anaytics

Module
Function
Schematic diagram
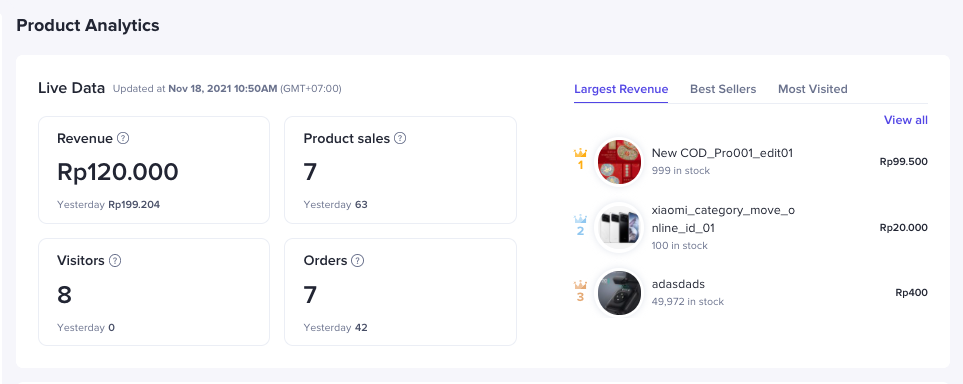
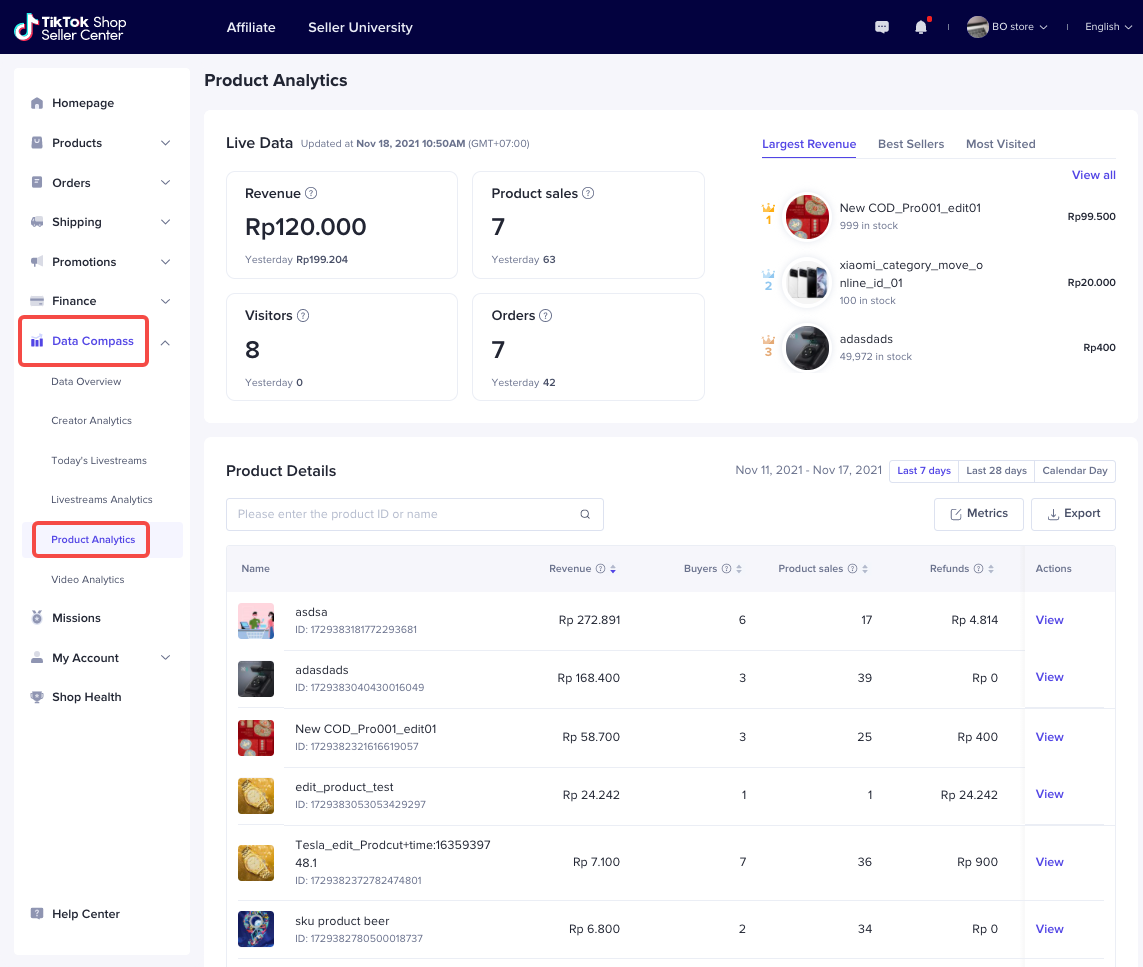
Live Data
  • Indicators:
    • Revenue: The accumulated transaction amount of all the products today, does not exclude the reverse order for applying for a refund of the goods. COD orders will be counted as soon as it is initiated.
    • Product Sales: The cumulative number of transactions for all products of the merchant today, does not exclude the reverse order for applying for a refund of the goods. COD orders will be counted as soon as it is initiated.
    • Visitors: De-duplicate number of visitors to the PDP of all the products.
    • Orders:The cumulative number of sku orders for all products today, does not exclude the reverse order for applying for a refund of the goods. COD orders will be counted as soon as it is initiated.
  • Data Comparison: Compared to yesterday's data
  • Live Transaction Chart:
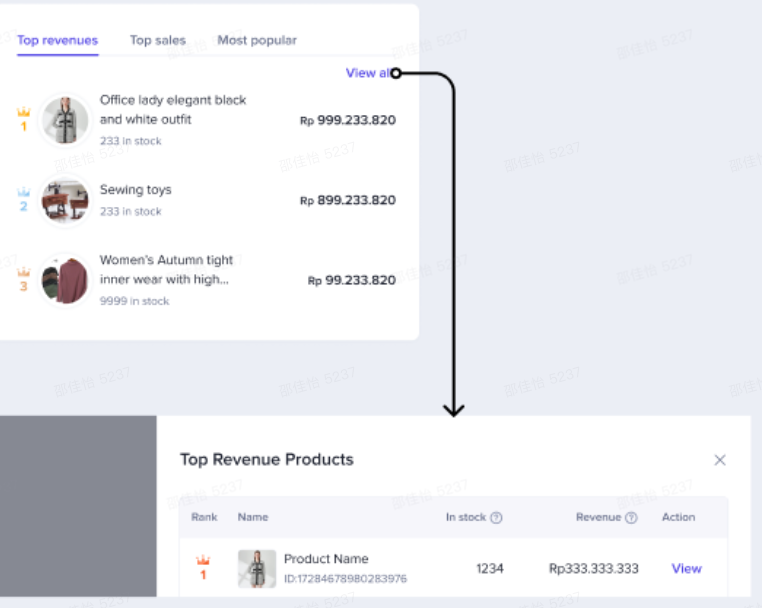
    • Display product thumbnail, product name, GMV that does not exclude reverse orders, and the saleable stock of the product of SPU;
    • Click "View All" in the upper right corner to enter the pop-up window to view the complete product chart;
    • Largest Revenue: Sorted by the GMV of the products from high to low, and only display products with GMV>0;
    • Best Sellers: Sort the products from high to low by the number of sales, and only display the products with sales> 0;
    • Most Visited: Sort by the number of visitors to the product detail page from high to low, and only display the products with salse> 0;
image.pngimage.png
Product Details
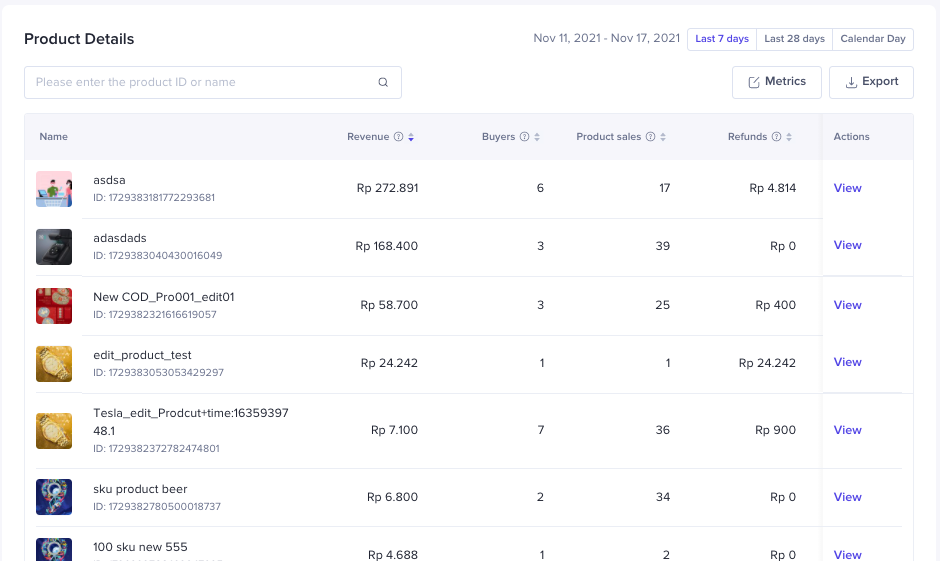
  • Filter:
    • You can select any day within 7/28 days of today or one day in the past 90 days
    • Search products by product name or product ID.
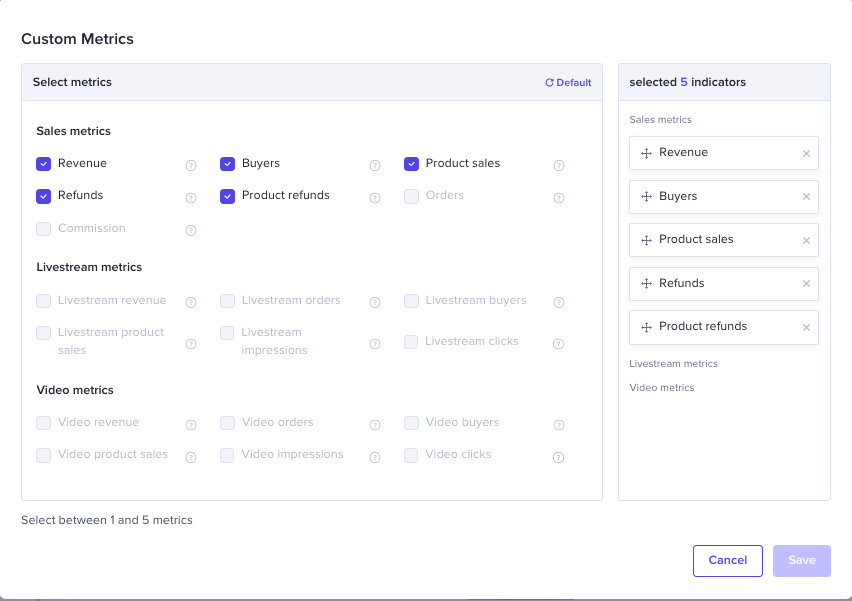
  • Custom Metrics:
    • Click the 'Metrics' button to pop up the Custom Mertics window;
    • At most 5 metrics and at least 1
    • Drag the metrics to change the display order
    • Hover on '?' to see the details of metrics meaning
    • Seller metrics: Revenue, Buyers, Product sales, Refunds, Product refunds, Orders, Commission
    • Livestream metrics: Livestream revenue, Livestream orders, Livestream buyers, Livestream product sales, Livestream impressions,Livestream clicks
    • Video metrics: Video revenue, Video orders, Video buyers, Video product sales, Video impressions, Video clicks
  • Data Sheet:
    • Product name and ID are displayed fixedly, and other data metrics can be configured
    • Sorted by Revenue from high to low by default
    • Except for product names and IDs that do not support sorting, all other metrics support sorting
  • Export data: Click the 'Export' button to export all the metrics. Only export the search results when the product search is completed
image.pngimage.png
Product Details
Product Details
Basic product information:
  • Product name
  • Product thumbnail
  • Product ID
  • Product salable status
  • Catagory:third level catagogy
  • Price:Display price range when the product has multiple sku
image.png
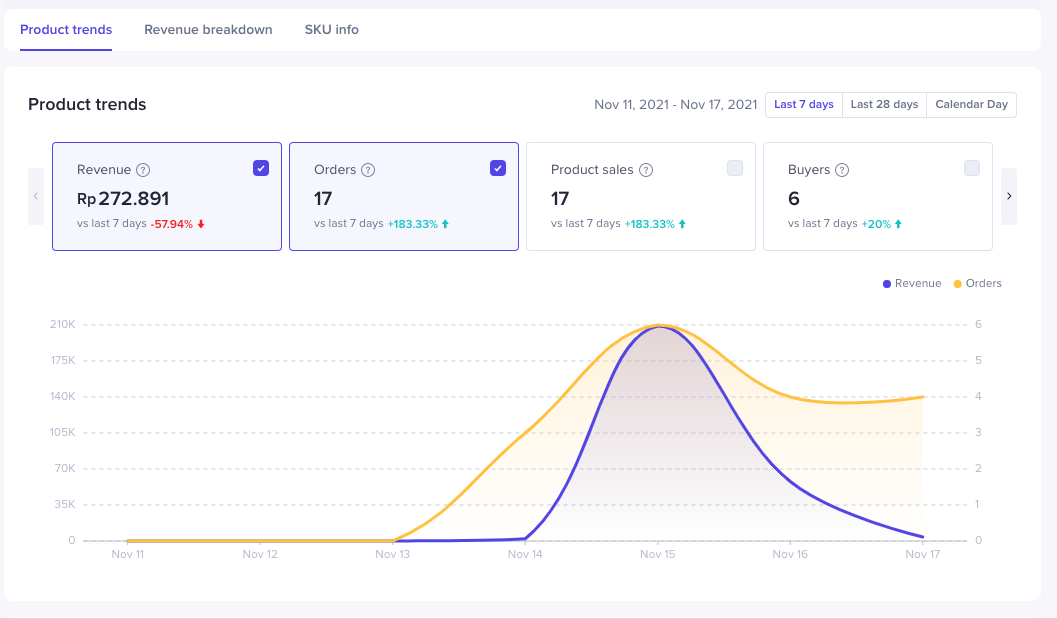
Product trends
  • Filter:
    • You can select any day within 7/28 days of today or one day in the past 90 days
  • Metrics
    • Transaction metrics: Revenue,Orders, Product sales, Buyers, Refunds, Product refunds, Commission
    • Livestream metrics: Livestream revenue, Livestream orders, Livestream buyers, Livestream product sales, Livestream impressions,Livestream clicks
    • Video metrics: Video revenue, Video orders, Video buyers, Video product sales, Video impressions, Video clicks
  • Data Comparison:
    • Last 7 Days: Show the percentage going up or down over the last 7 days
    • Last 28 Days: Show the percentage going up or down over the last 28 days
    • Natural Day: Show the percentage going up or down over the previous day
  • Trend:
    • Display the indicators trend corresponding to the selected metrics. Support selecting at most 2 indicators at the same time
    • Hover on the data point to check details.
    • Last 7 days:Display the data trend of the last 7 days, one data point per day
    • Last 28 days: Display the data trend of the last 28 days, one data point per day
    • Natural day: Display a histogram of data for each hour of the day
image.png
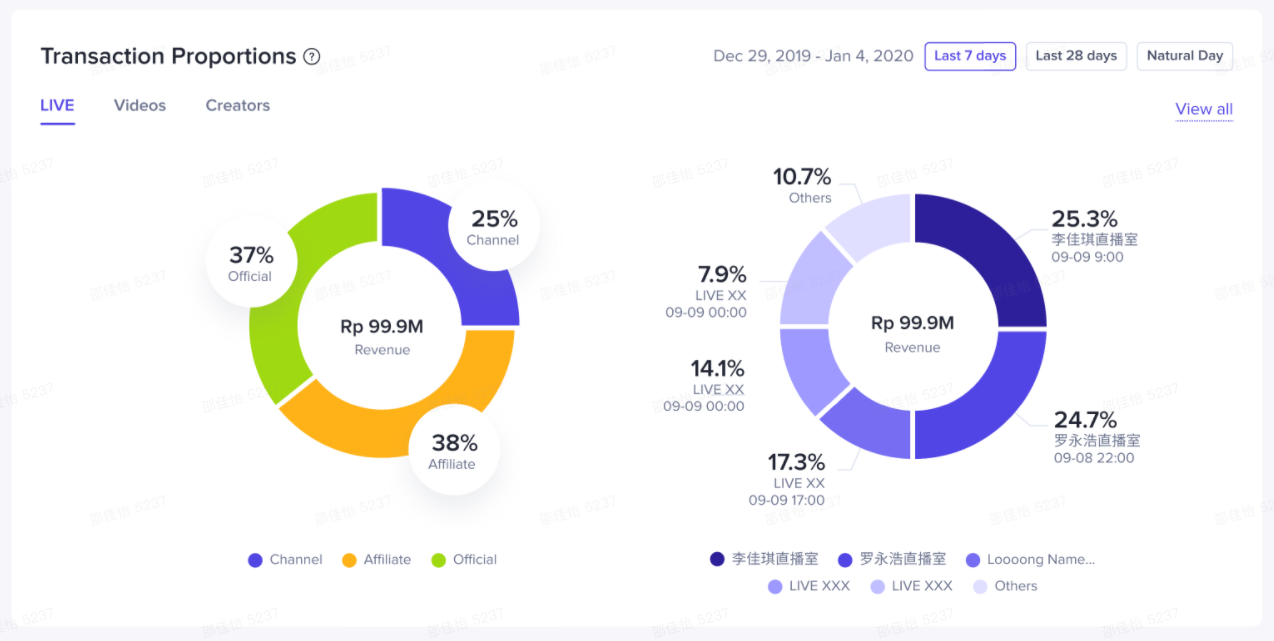
Revenue breakdown
  • Filter:
    • You can select any day within 7/28 days of today or one day in the past 90 days
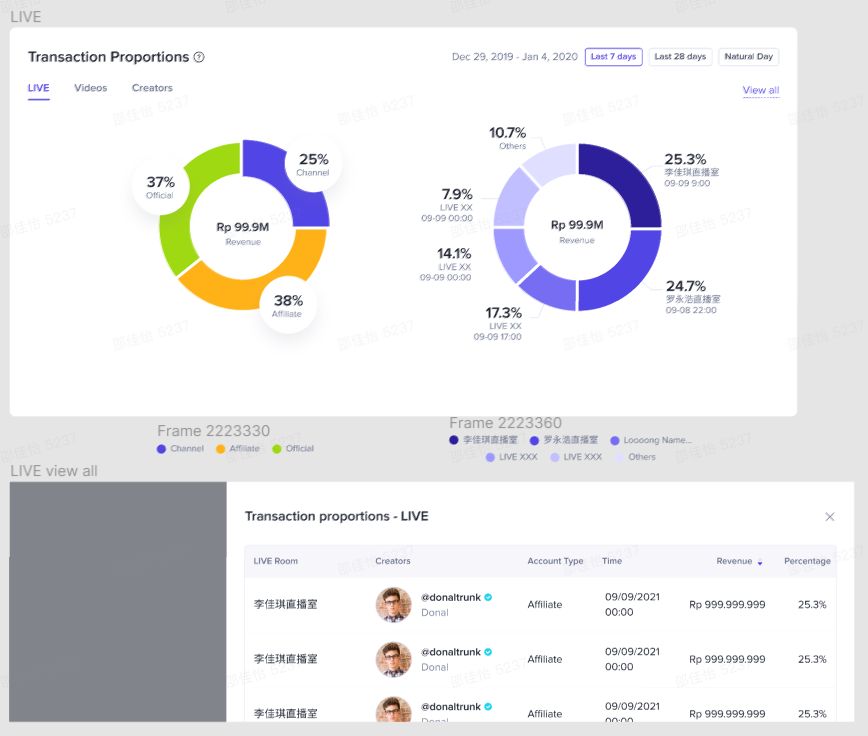
  • Livestream breakdown:
    • By account type:
      • Official live room
      • Channel live room(created by marketing accounts)
      • Affiliate live room(created by Affiliate accounts)
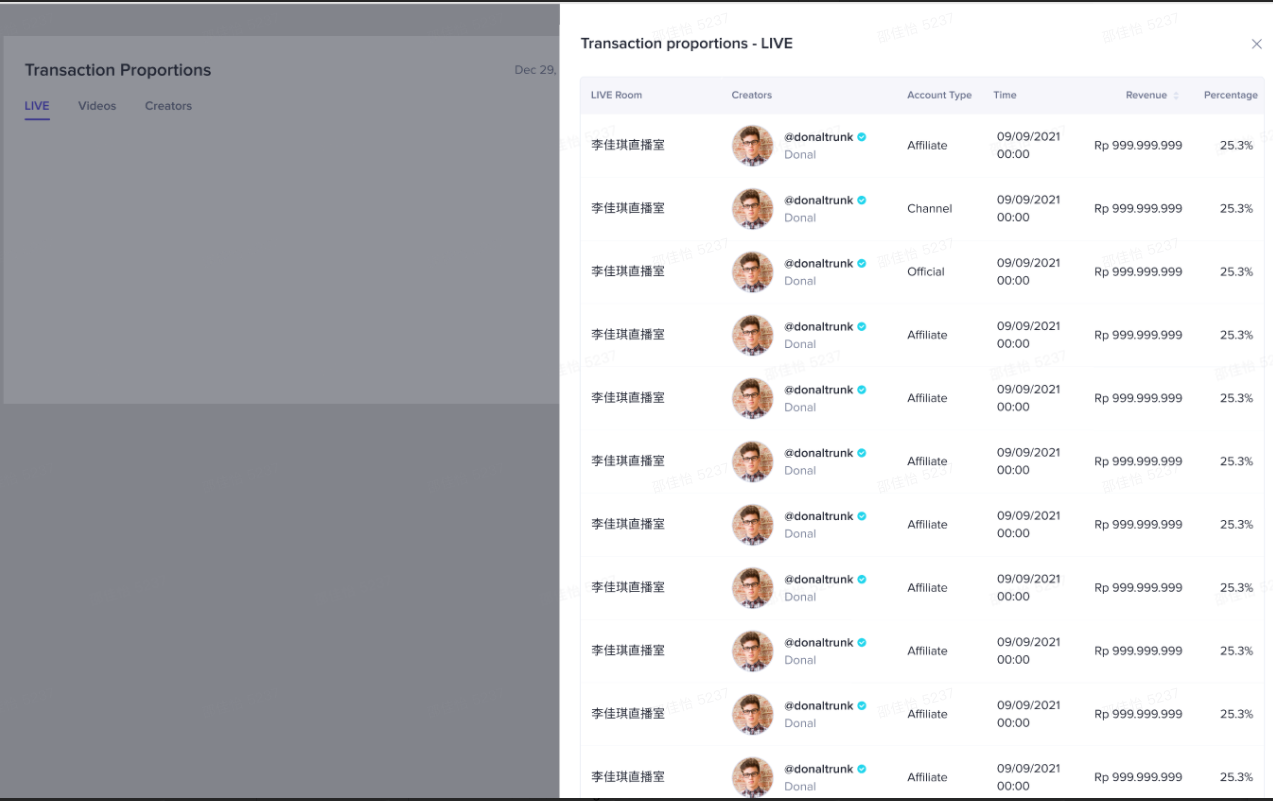
    • By livestream:Display TOP5 transaction live rooms, the rest are classified as others
    • Click "View All" to enter the pop-up window then display the product's transaction details in each live room. By default, it is ranked by revenue, and also include livestream info, Creator, Account type, LS Time, LS Revenue and Percentage
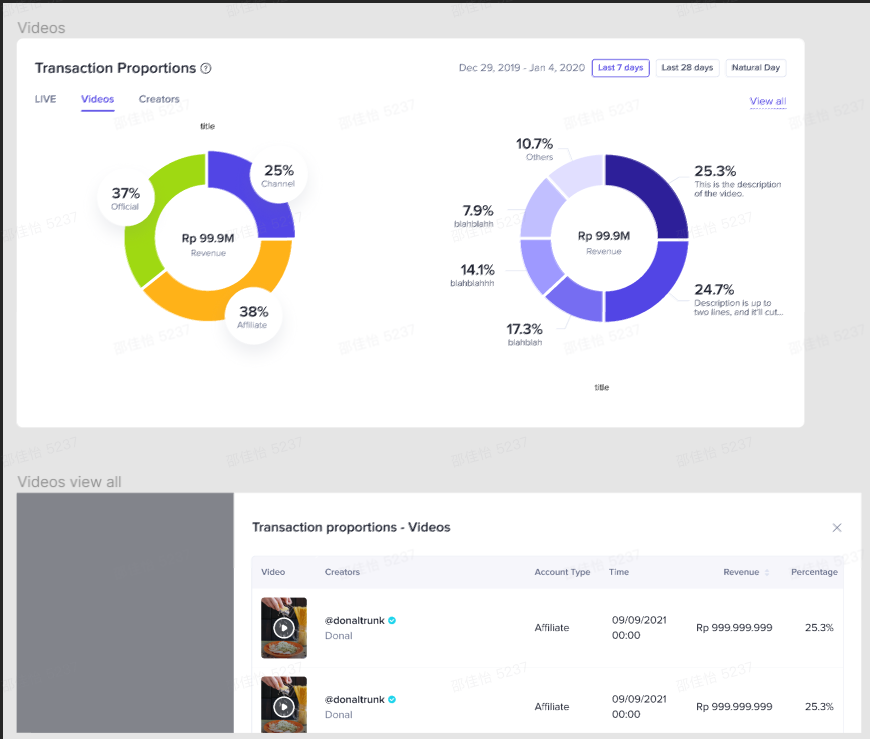
  • Video breakdown
    • By account type:
      • Official video
      • Channel video(created by marketing accounts)
      • Affiliate video(created by Affiliate accounts)
    • By videos:Display TOP5 transaction videos, the rest are classified as others
    • Click "View All" to enter the pop-up window then display the product's transaction details in each video. By default, it is ranked by revenue, and also include video info, Creator, Account type, video published Time, video Revenue and Percentage
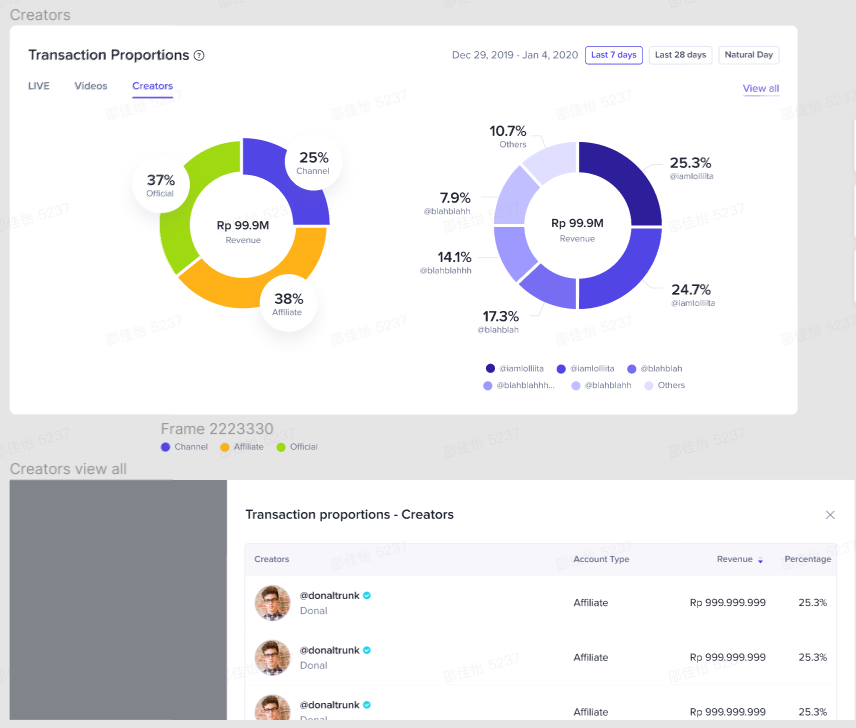
  • Creator breakdown
    • By account type:
      • Official account
      • Channel account(marketing account)
      • Affiliate account
    • By creators:Display TOP5 transaction creators, the rest are classified as others
    • Click "View All" to enter the pop-up window then display the product's transaction details by each creator. By default, it is ranked by revenue, and also include Creator info, Account type, Revenue and Percentage
image.pngimage.pngimage.pngimage.pngimage.png
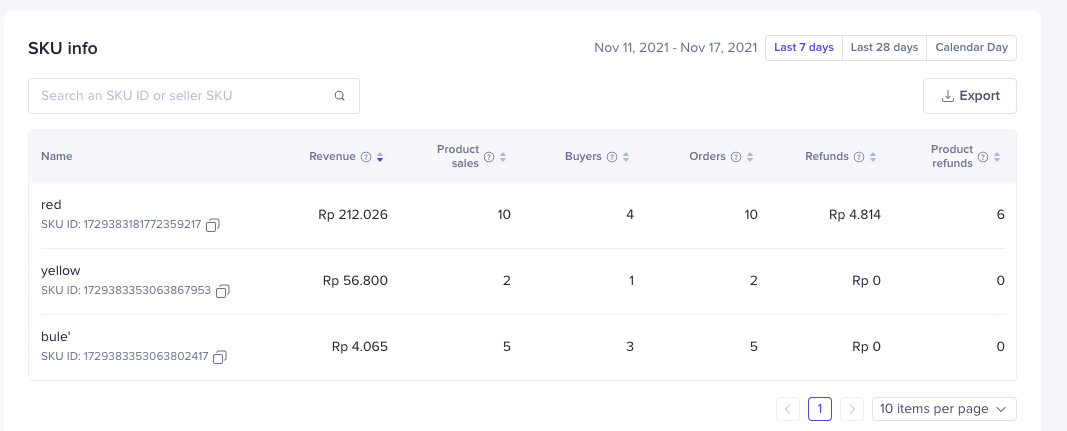
SKU info
  • Filter:
    • You can select any day within 7/28 days of today or one day in the past 90 days
    • Search products by sku ID or seller sku.
  • Metrics:
    • Sku info(name and ID)
    • Revenue: The revenue earned from sales of the SKU
    • Product sales: The quantity of the SKU sold
    • Buyers: The number of unique users who ordered the SKU
    • Orders: The number of SKU orders for the SKU
    • Refunds: The amount successfully refunded for the SKU
    • Product refunds: The quantity of the SKU successfully refunded
  • Data export: Click'Export' to export all metrics. If the searching has been completed, export the searching results
image.png

f. Video Analytics

Module
Function
Schematic diagram
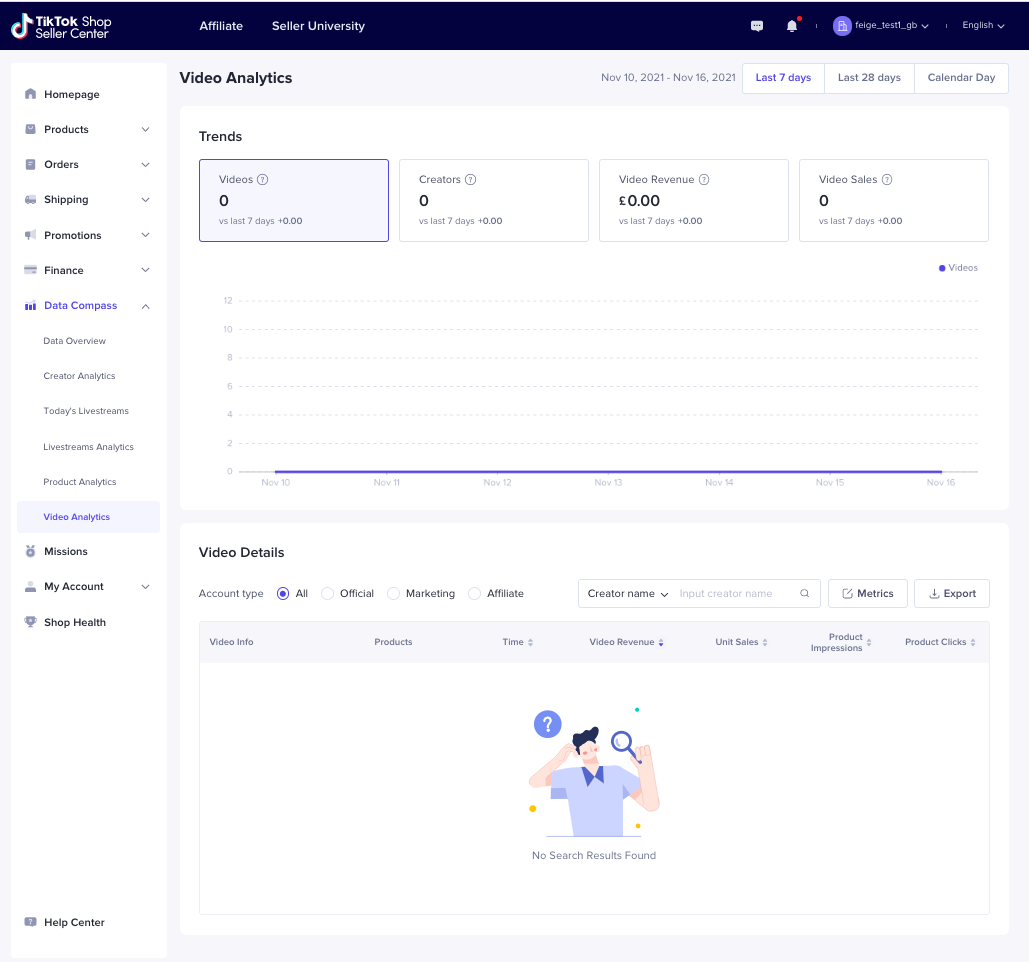
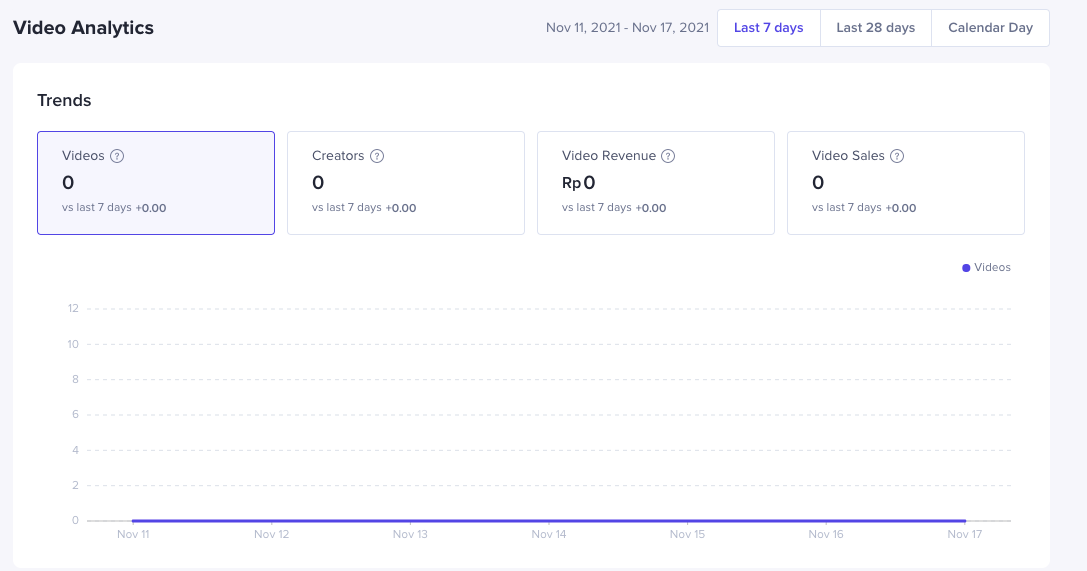
Trends
  • Filter:
    • You can select any day within 7/28 days of today or one day in the past 90 days
  • Indicators:
    • Videos: During the statistical period, the number of e-commerce videos containing merchant products, including videos published by official accounts, channel accounts, and Affiliate accounts. If the video is deleted or blocked by the author after release, the video will still be counted
    • Creators: During the statistical period, the number of creators who have posted e-commerce videos for merchants, including official creators, channel creators, and Affiliate creators. If the video is deleted or banned by the author after the video release, the video will still be counted
    • Video Revenue: During the selected period, the cumulative revenue of all videos, not excluding reverse data such as returns and refunds
    • Video Sales: During the selected period, the cumulative number of products from all videos, not excluding reverse data such as returns and refunds
  • Data Comparison:
    • Last 7 Days: Show the percentage going up or down over the last 7 days
    • Last 28 Days: Show the percentage going up or down over the last 28 days
    • Natural Day: Show the percentage going up or down over the previous day
  • Trend:
    • Display the indicators trend corresponding to the selected metrics. Only display one metric at a time
    • Hover on the data point to check details.
    • Last 7 days:Display the data trend of the last 7 days, one data point per day
    • Last 28 days: Display the data trend of the last 28 days, one data point per day
    • Natural day: Display a histogram of data for each hour of the day
image.png
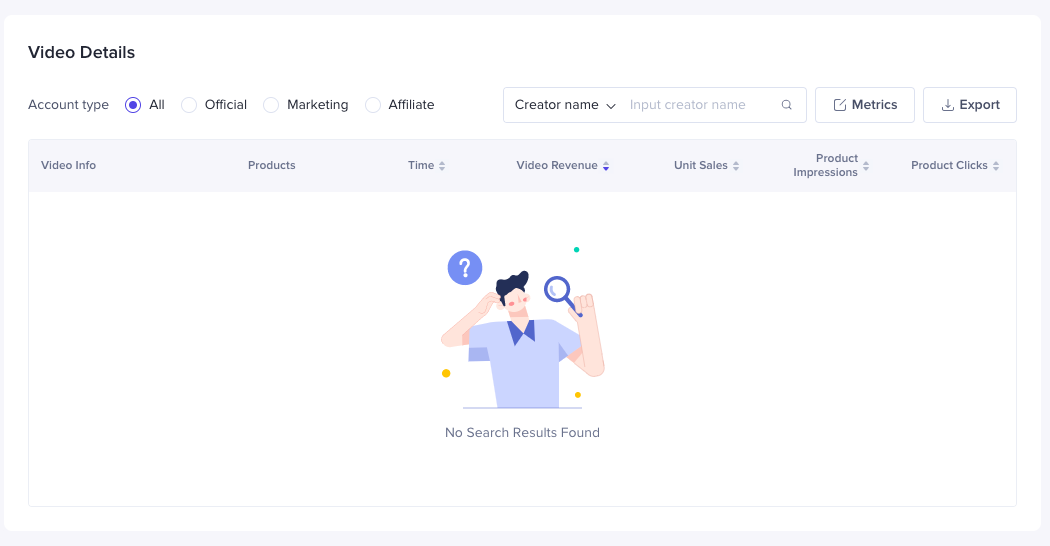
Video Details
  • Filter:
    • By account type:
      • All
      • Official account
      • Marketing account
      • Affiliate account
    • Search by Creator name or Video name
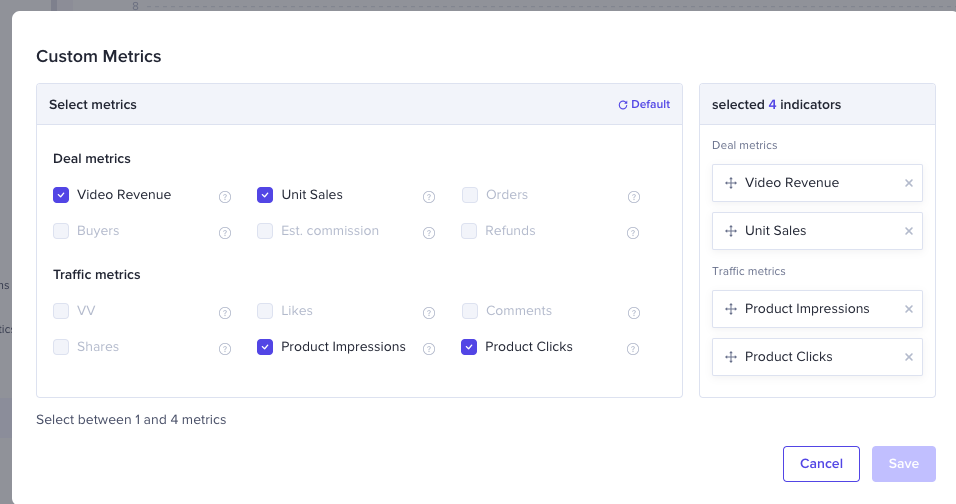
  • Custom metrics:
    • Click the 'Metrics' button to -Click and enter the metrics configuration pop-up window to change the header of the data table
    • Deal metrics: Video Revenue, Unit Sales, Orders, Buyers, Est. Commission, Refunds
    • Traffic metrics: VV, Likes, Comments, Shares, Product Impressions, Product Clicks
  • Data sheet:
    • By default, display video info, product info and video published time, the other fields are selected in the metrics configuration window. Sellers can select at least 1 and at most 4.
    • Sort by video transaction amount by default
    • If a video has multiple product anchors, all linked product info will be displayed
    • Click the product name then enter the PDP page
  • Data export:
    • Click 'Export' button to export all metrics,
    • Click'Export' to export all metrics. If the searching has been completed, export the searching results
image.pngimage.png